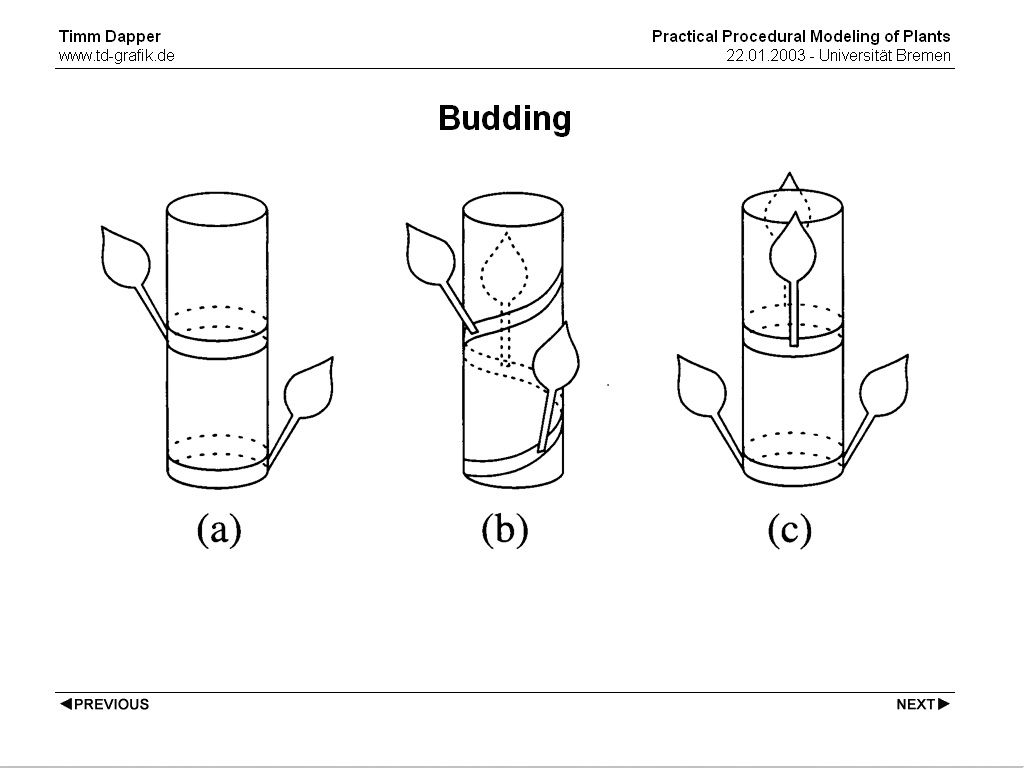
An important part of a plants morphology is the bud. A bud is where every part of a plants body starts growing. There are two different types of buds, the apical bud at the end of a branch and the lateral buds which can grow new branches, leafs or flowers. The starting point for leaves or subbranches at a branch is called Nodus, the part between two nodes is the Internodium. A node can grow one or more leaves, the angular distance between all leaves grown at one Node will be constant.
distichie
there's one leaf per node, leafs of cunsecutive nodes are rotated by 180 degrees
dispersion
there's one leaf per node, but consecutive leafs are rotated by the golden mean
(later), building up a spiral shape
dekussation (dt.: wirtelig)
several leaves per node (equidistant), leaves alternate - on gap - Alternanz (for two
leaves each knot is rotated 90deg)
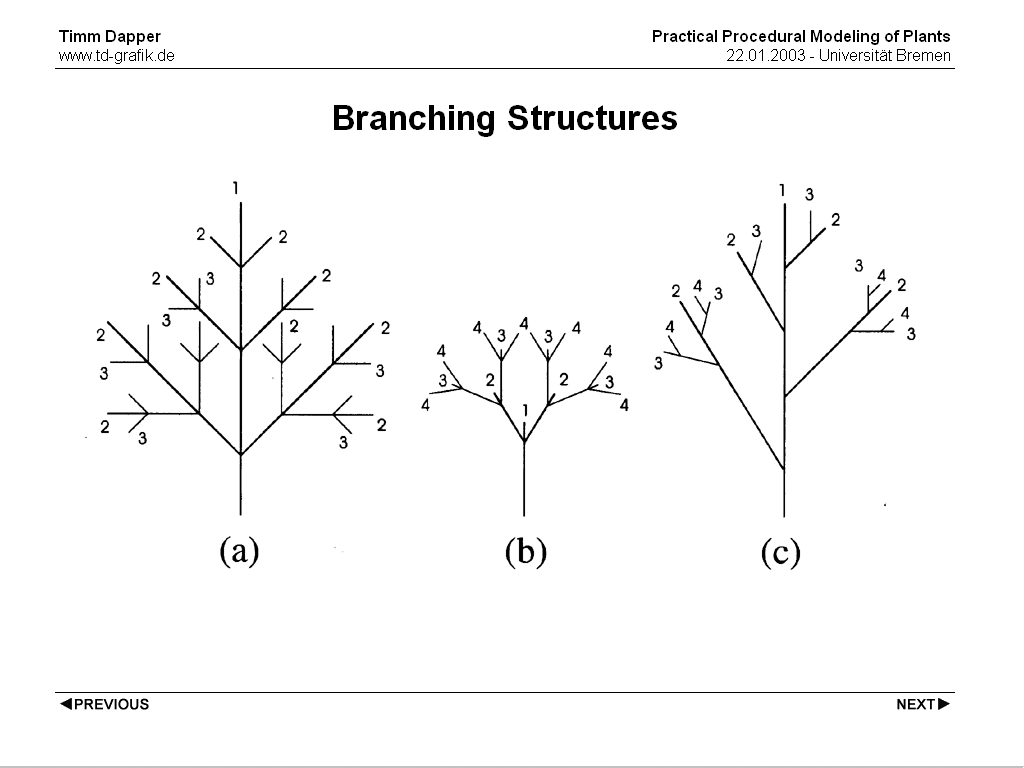
Branching Structure
either the main axis or the 1st or higher order branches are dominant in a plant
monopodial
the main axis is longer & stronger, this principle also applies to higher order branches
=> leads to a cone shape
sympodial
branches are dominant
=> buds stop growing after one period so the structure can only build up by following
branches
branches are arranged dekussativ
=> regular dichasium
is one of the branches dominant
=> monochasium (often elongates the main axis)
trees often show different growth between the area of the trunk and the treetop. While the upper branches building the crown grow very fast, lower branches grow slower and eventually die. This behaviour is called Ahrotonie. This behaviour heavily depends on the stand of the tree. For trees standing in direct neighbourhood to other trees it is much stronger because of the lighting conditions. A free standing tree will rather try to fill up as much room as possible to gather as much light as possible.
Another important aspekt of plant growth is tropism, gravitropism or phototropism. Bending towards the light and bending towards gravity.
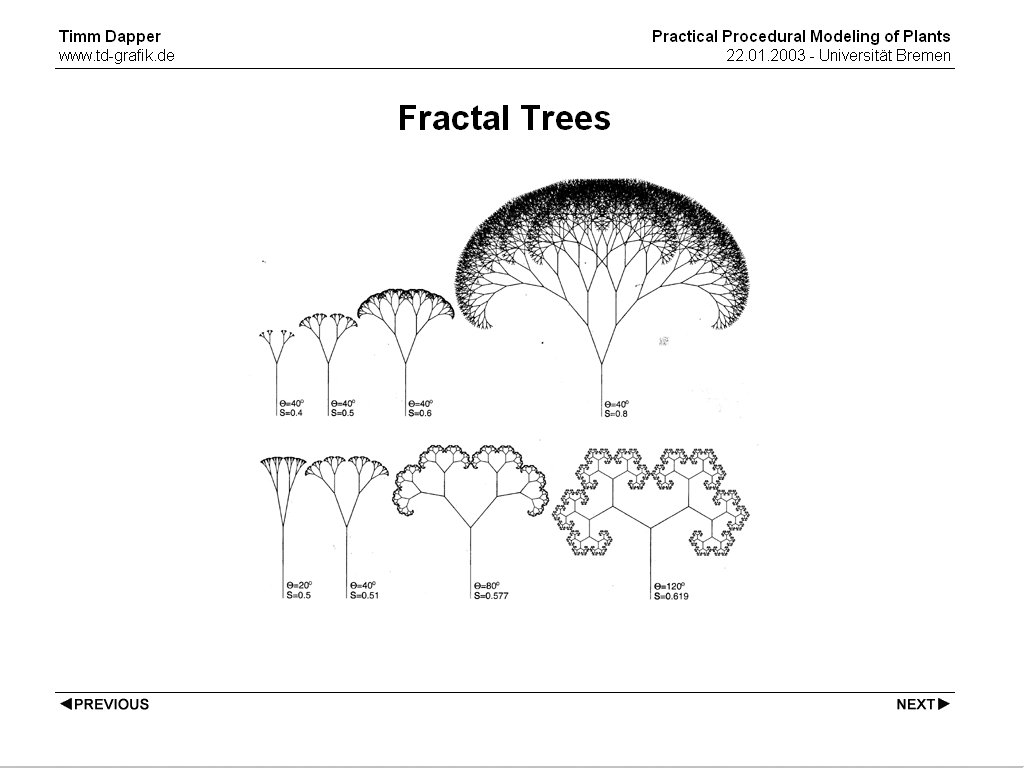
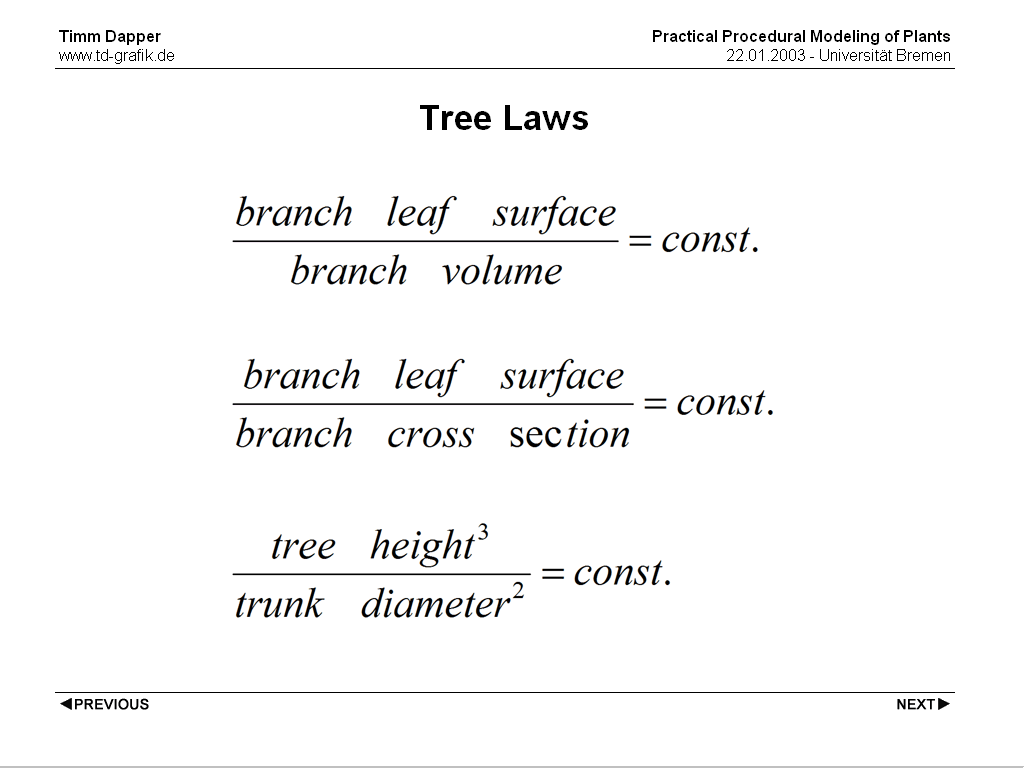
A common attempt to model trees was using fractal branching structures. This lead to interesting results it actually makes sense when you look at a tree to assume that a small part of the tree has the same structure as the whole tree. Halle, Oldemann and Tomlinson reduced this to a problem of energy transfer. A tree has to supply itself with water and thus needs minimal paths, at the same time it needs as much surface as possible for energy absorbtion. This nearly automatically leads to fractal shapes. Still, when you start taking branch thickness into account, trees are not fractals! Leonardo da Vinci assumed that the sum of the cross sections of the child branches add up to the cross section of the parent branch, so that:
d^2 = d1^2 + d2^2
which is a very good assumption for real trees.
A small twig does indeed look somewhat like the whole tree, but it's too thin to be a true fractal.
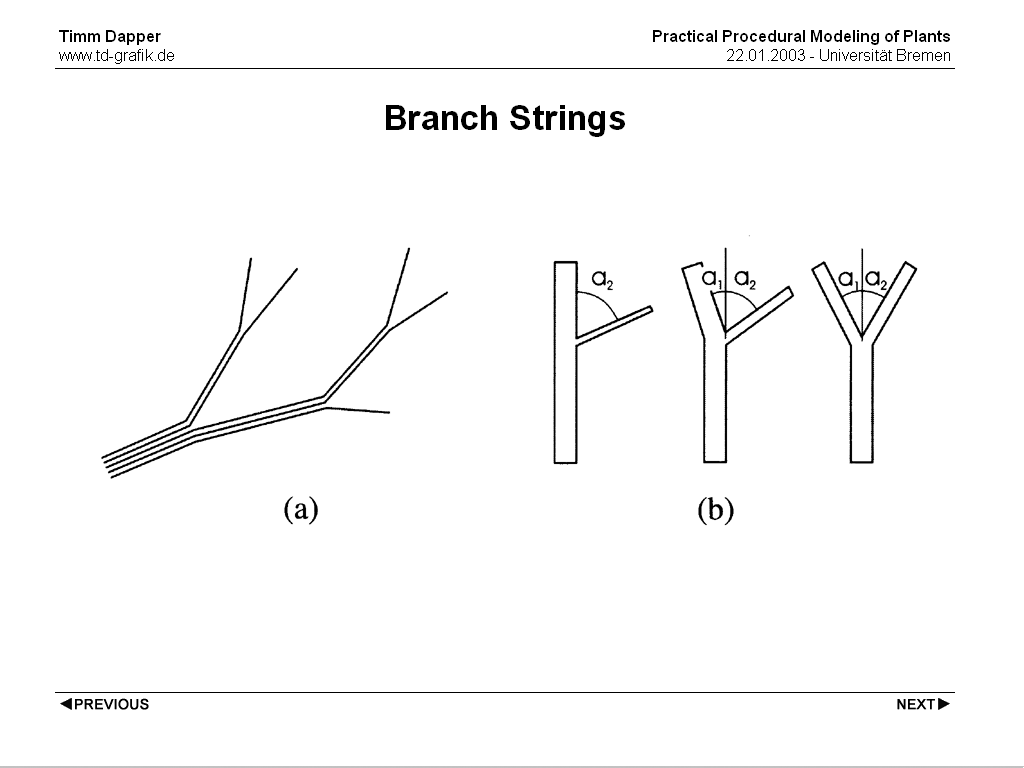
Da Vinci came up with this by thinking of a branching structure as a number of strings. At each node the strings are devided between the branches. An addition to this is that it seems that the thickness of the branch directly depends on the branching angle. The smaller the angle to the parent branch, the thicker the new branch. A few modeling methods are based on this observation.
There are a few different approaches to plant modeling. One basically has to decide whether he wants to start with the basic shape of the tree and define the details afterwards or if the tree should be developed more like in nature, starting at the seend and then growing/adding/refining elements to get a final shape. While the latter is more based on actual botanical facts, the former has a great artistic appeal.
This leads to the second choice, do we want to base our simluation on botanical research and use models that actually simulate the growth of a plant or do we want to use models that try to recreate patterns typically found in botany but are not necessarily based on botanical facts. The former approach has some scientific appeal and would theoretically lead to a significantly reduced set of parameters (since only plants that make sense from a botanical point of view could be created). The problem is that it suffers from the still existing lack of knowledge about plant growth and development processes. Also the latter often leads to more predictable results and more intuitive parameters (e.g. a number of branches). Also they are usually faster as they tend to work with some simple model instead of an actual simulation.
Typical approaches to plant modeling are procedural, rule-based and hybrid approaches. There is no direct mapping between certain approaches and certain modeling methods, but rule based approaches and sometimes also hybrid approaches usually don't mix very well with the top down paradigm.
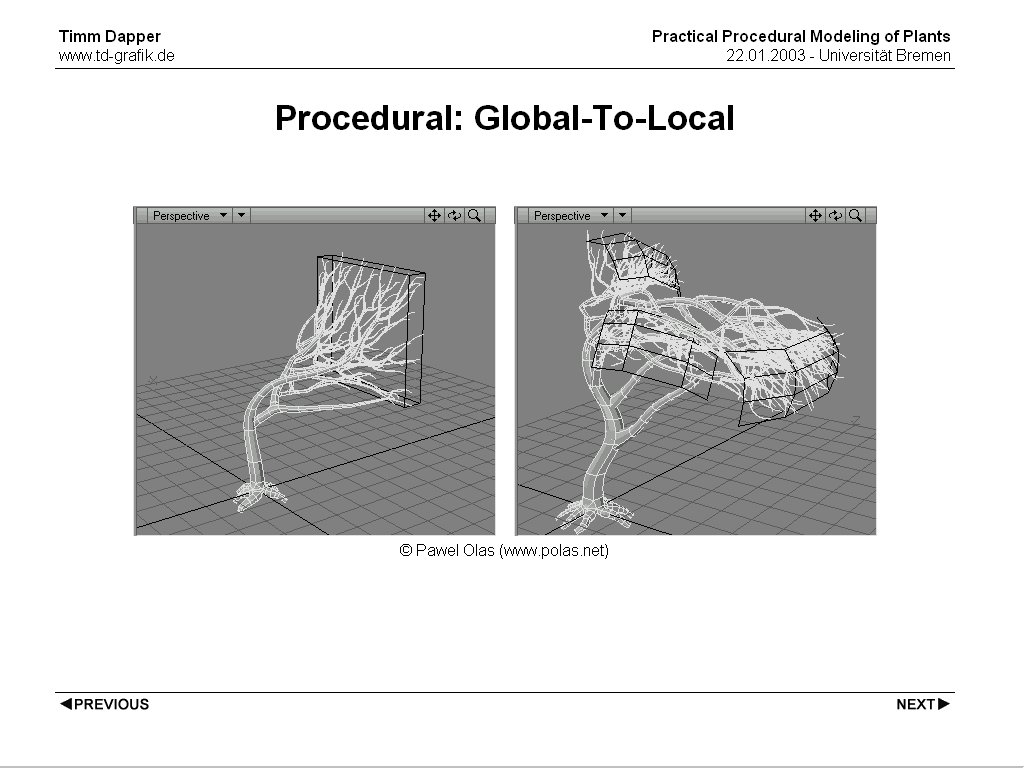
The global to local approach is generally a little trickier (and therefore you'll see it less often). This is mostly due to the process of refining a global shape to something that looks like a plant/tree is counterintuitive from a programming/simulation standpoint. Cases in which this approach is the dominant paradigm are usually procedural approaches. A nice example is TreesDesigner by Pawel Olas, based on a few parameters it creates a branching structure with branches that always end up on surfaces defined as input. This has nearly no botanical background, but if gives CG artists great flexibility defining the exact shape of plants without having to create a model from the ground up and then modify it until is comes close to the shape he's looking for.
All other approaches presented here tend to be rather local-to-global, even though they can be extended to incorporate global parameters to a certain degree.

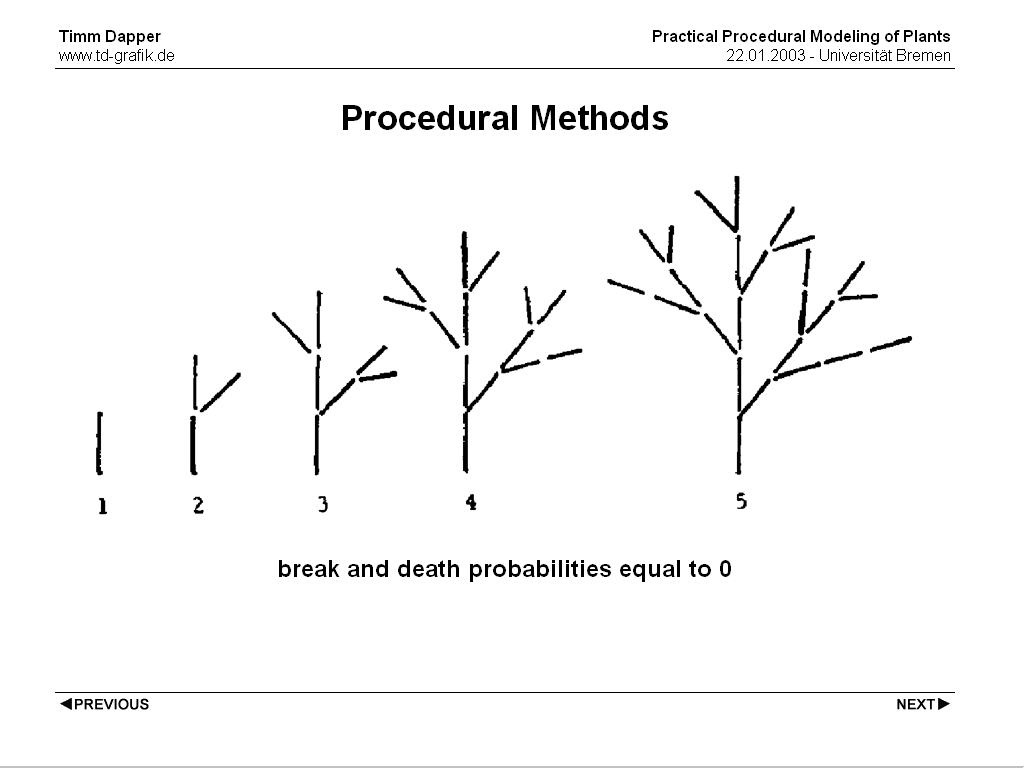
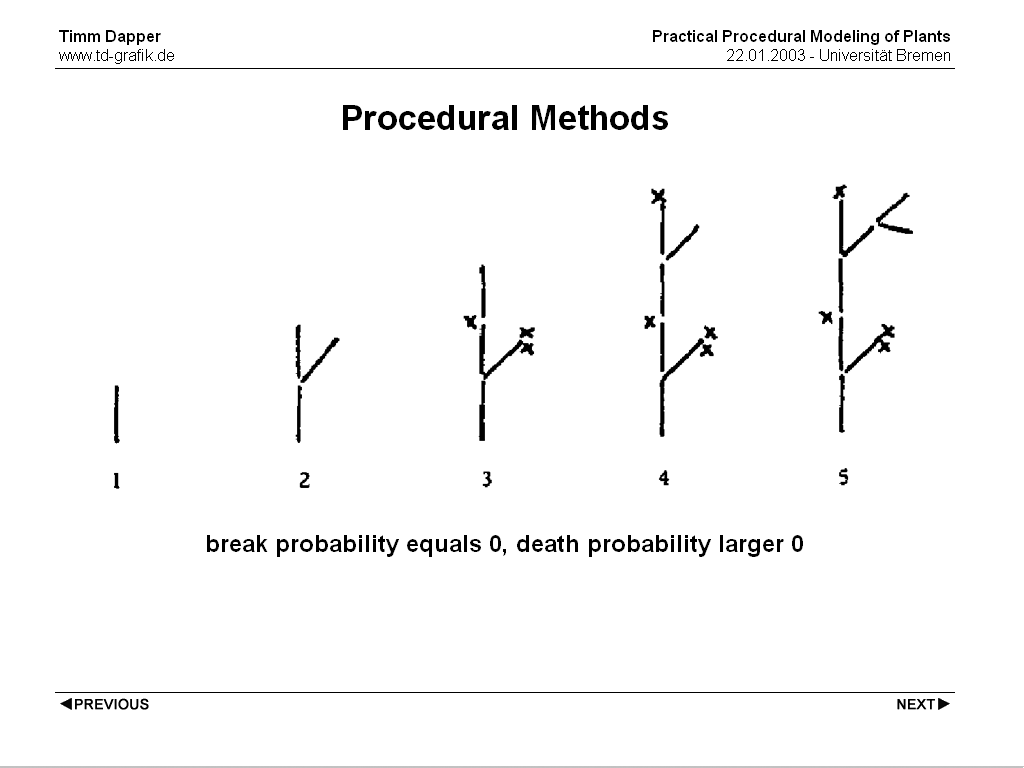

One procedural approach based on budding has been presented by de Reffye in 1988. The growth of plants is simulated in discrete time steps. At each time step a bud can become a flower, go to sleep, grow an internode with an apical and a number of lateral buds or die. Probablities for each of these behaviours is given as a function of age, dimension and order. (dimension = size, order = branch order).
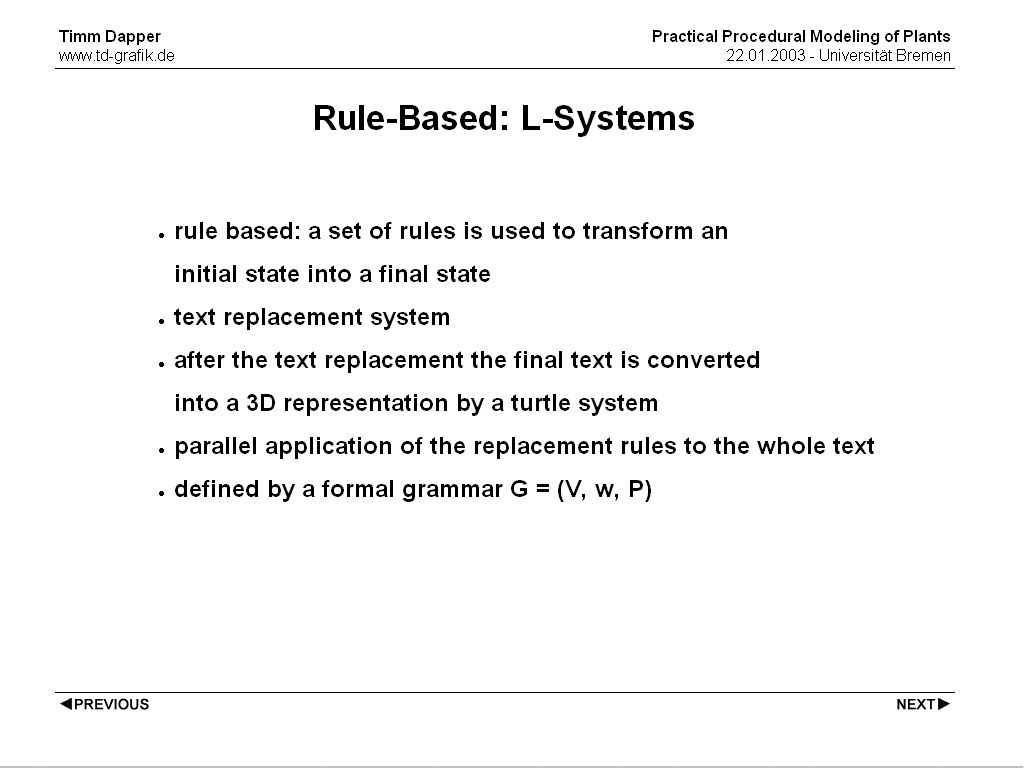
A classical example of rule based approaches to Plant modeling are L-Systems, named after Aristid Lindenmayer who introduced them in 1968. Rule based means that a number of rules is applied to an initial state to transform it to some final state. In the case of L-Systems this happens as text replacement. An important aspect of L-Systems is that this replacement happens at every place of the text in parallel (as opposed e.g. recursive). The rationale for this is that growth of a plant happens in parallel as well.
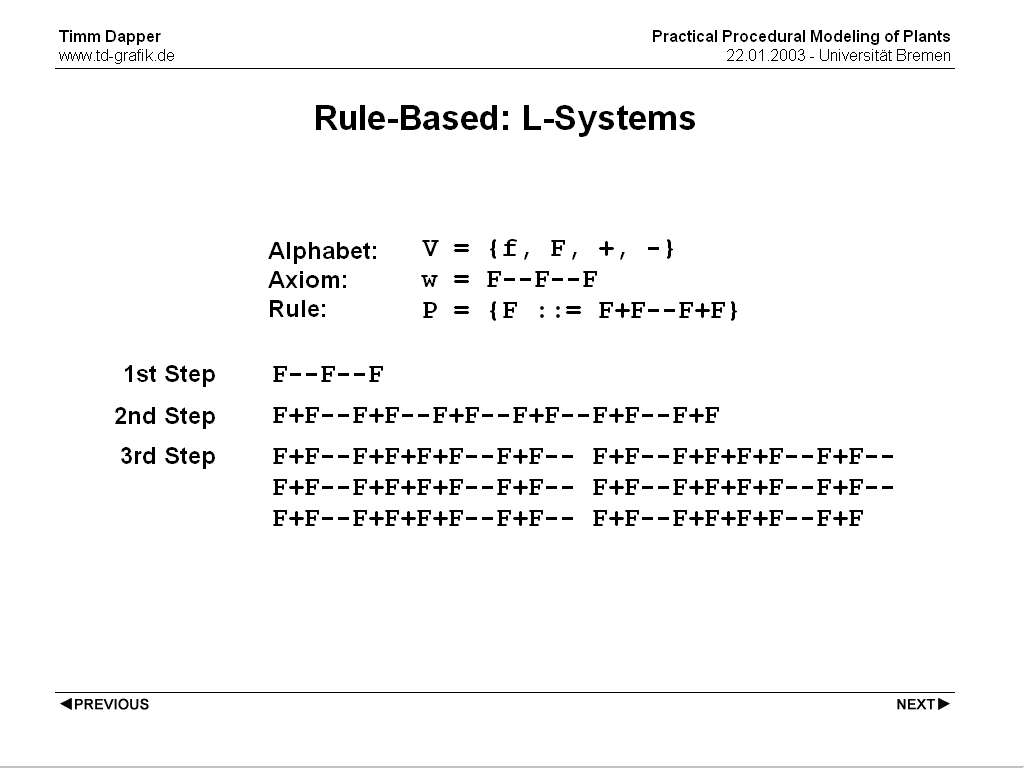
An L-System is represented by a Formal grammar G = (V, w, P) with V being the Alphabet, w being the initial state, and P begin a number of Productions (replacement rules).
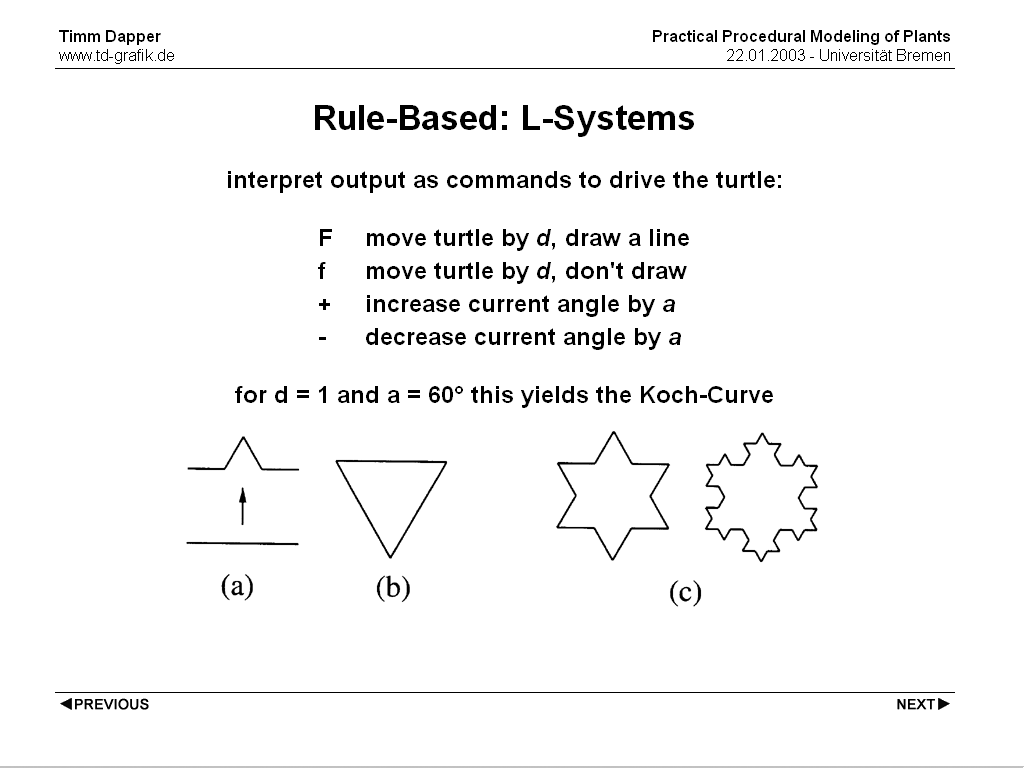
After the process created the final state (a text again) the text needs to be interpreted to create 3D geometry. The most common approach is to use the output text to control a LOGO style turtle. Doing so the prior example yields the well known Koch Curve.
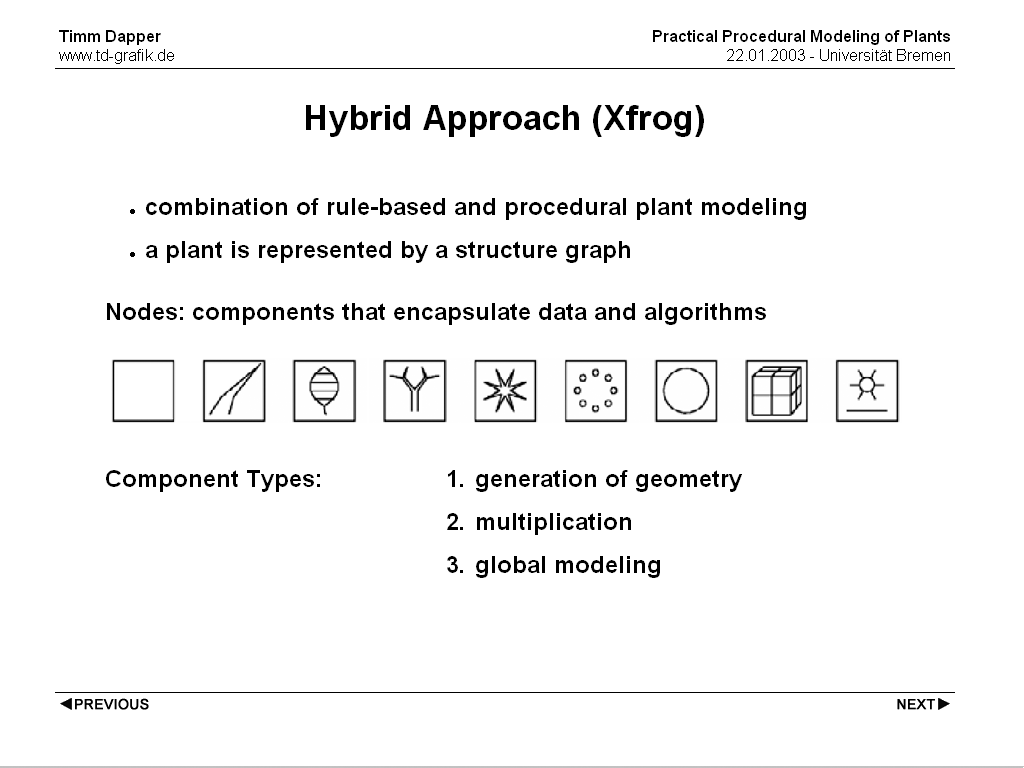
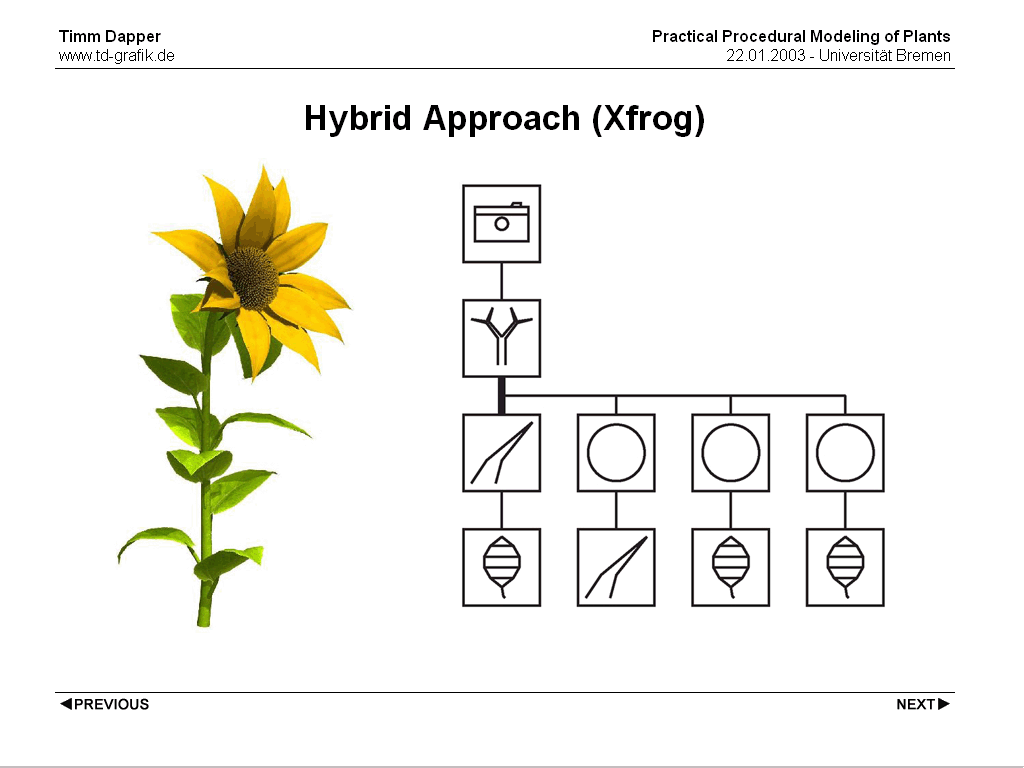
Hybrid approaches like the Xfrog modeling system try to take the advantages of both systems (namely the flexibility of L-Systems and the ease of use of Procedural methods) and combine them. A plant is represented by a structure graph, the structure consists of different Components encapsulating certain modeling procedures. These procedures can 1. create geometry 2. multiply geometry or 3. perform global modeling. An example shows the structure graph of a sunflower.
Phyllotaxis is the arrangement of Plant Organs on the Plant body.
While these patterns at the first look seem to be very random and don't seem to follow specific rules, there's actually quite an amount of repeating patterns in plants.
"Ordinary field daisies have 34 petals... a fact to be taken in consideration when playing 'she loves me, she loves me not'!"
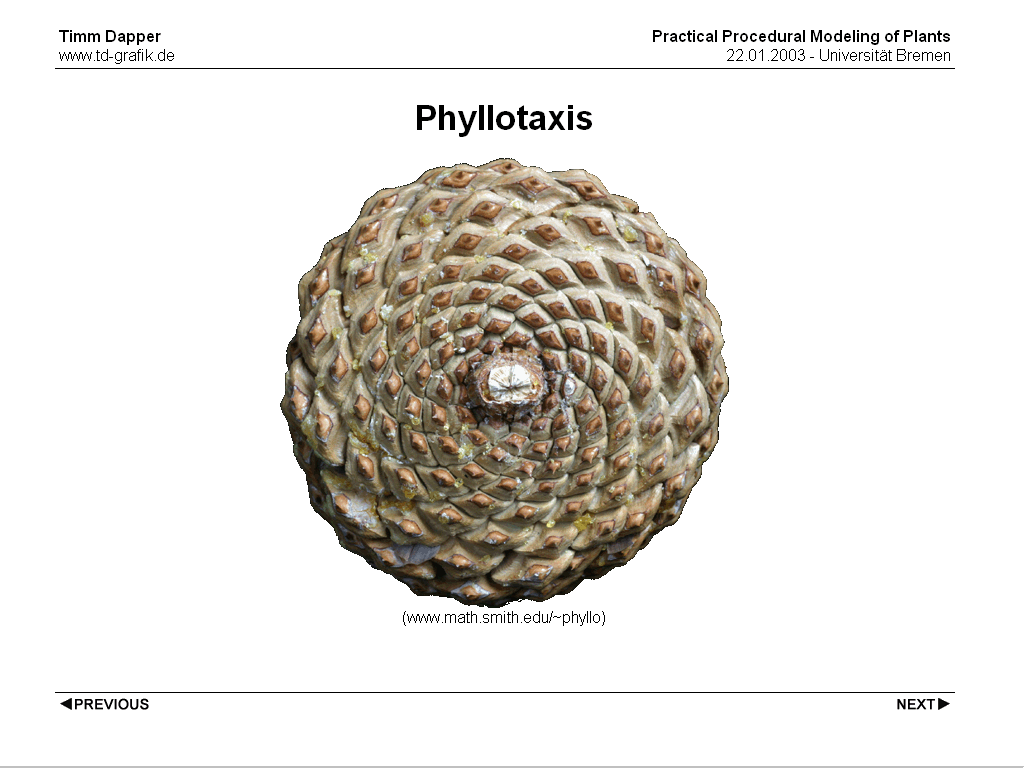
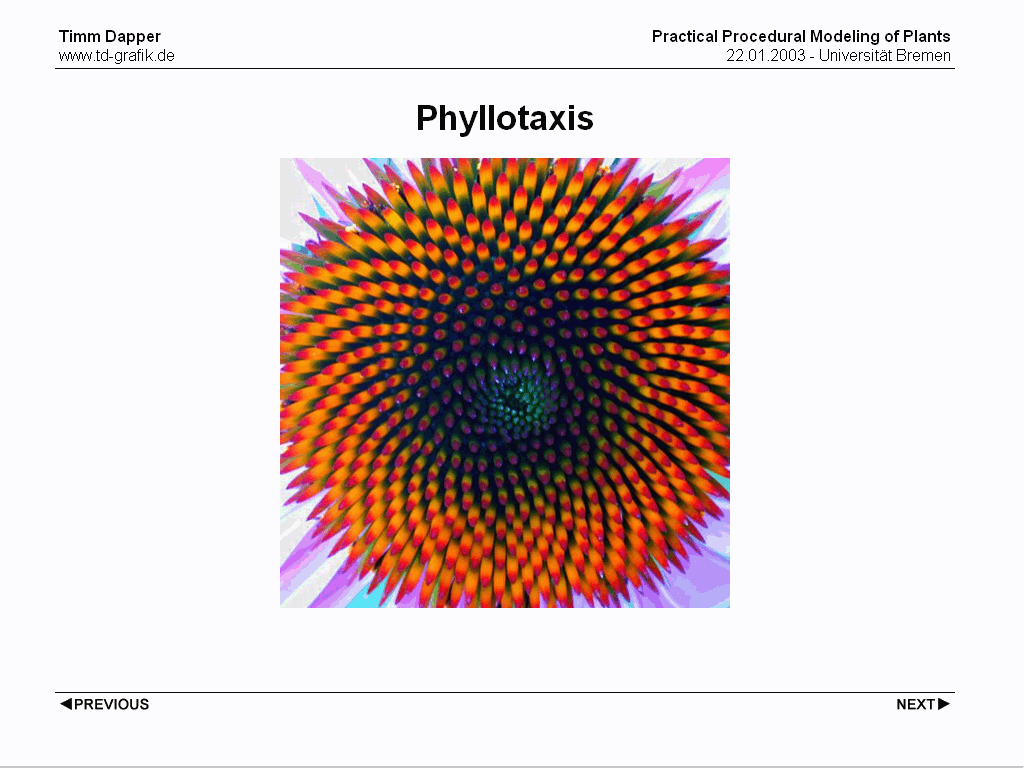
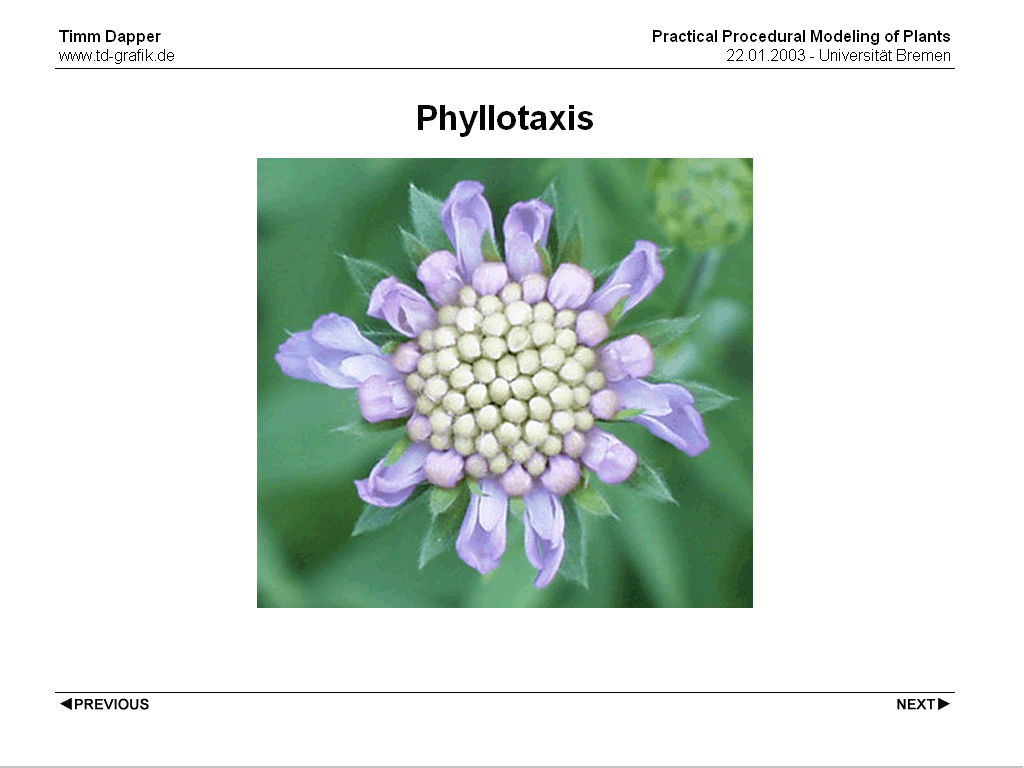
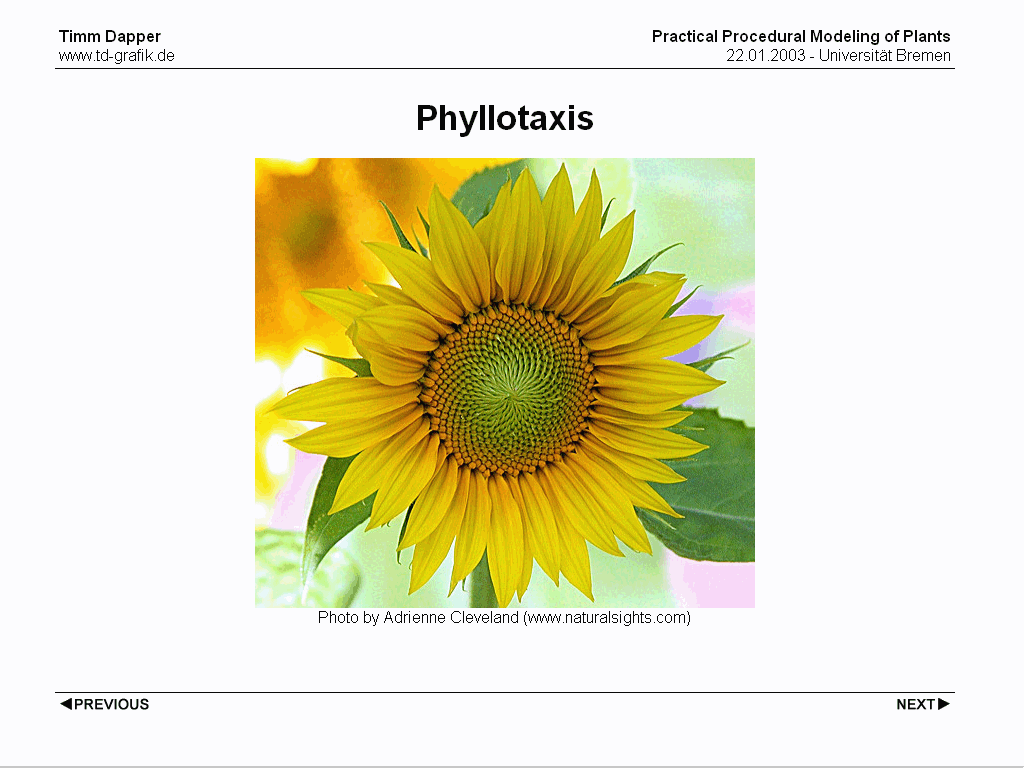
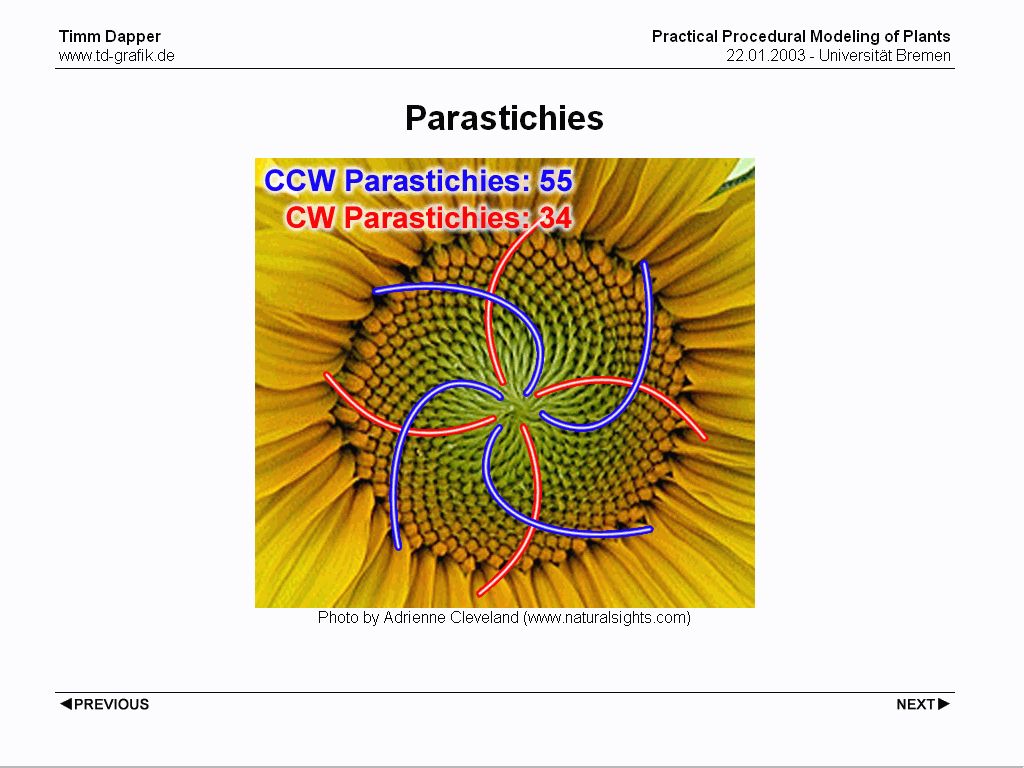
Usually there are two sets of spirals revolving in opposite directions, counting them both will in most cases result in two following numbers of the Fibonacci Sequence.
There have been quite a few attempts to model these patterns, three of them will be presented here in short.
The first model is the one presented by Vogel in 1979
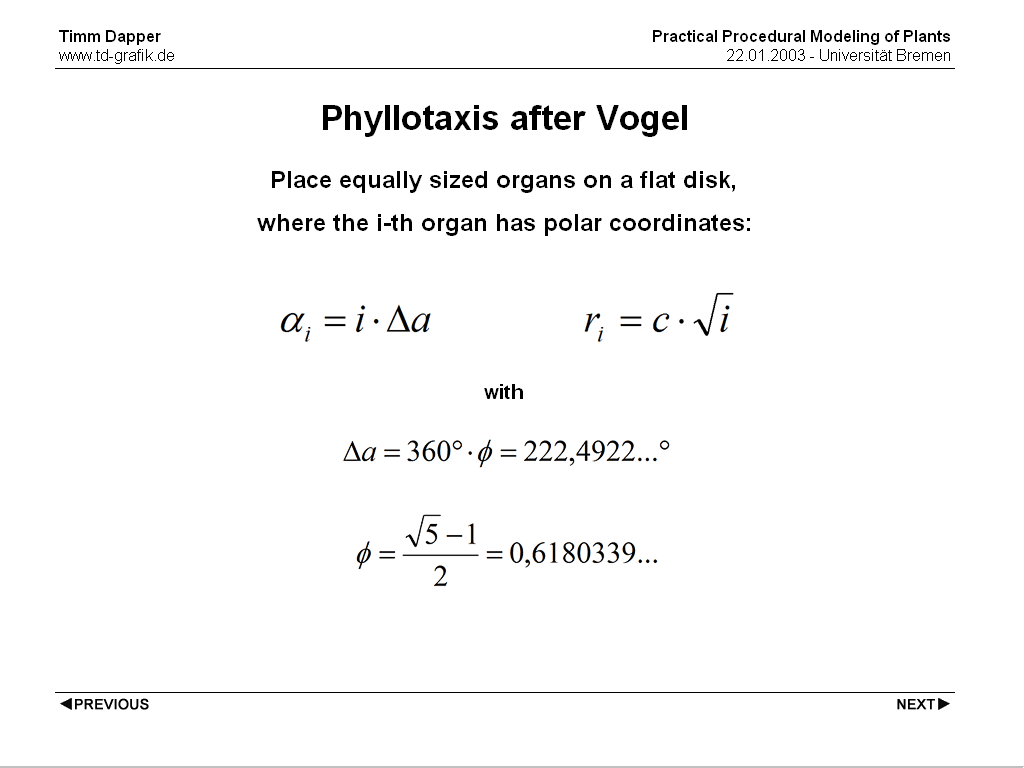
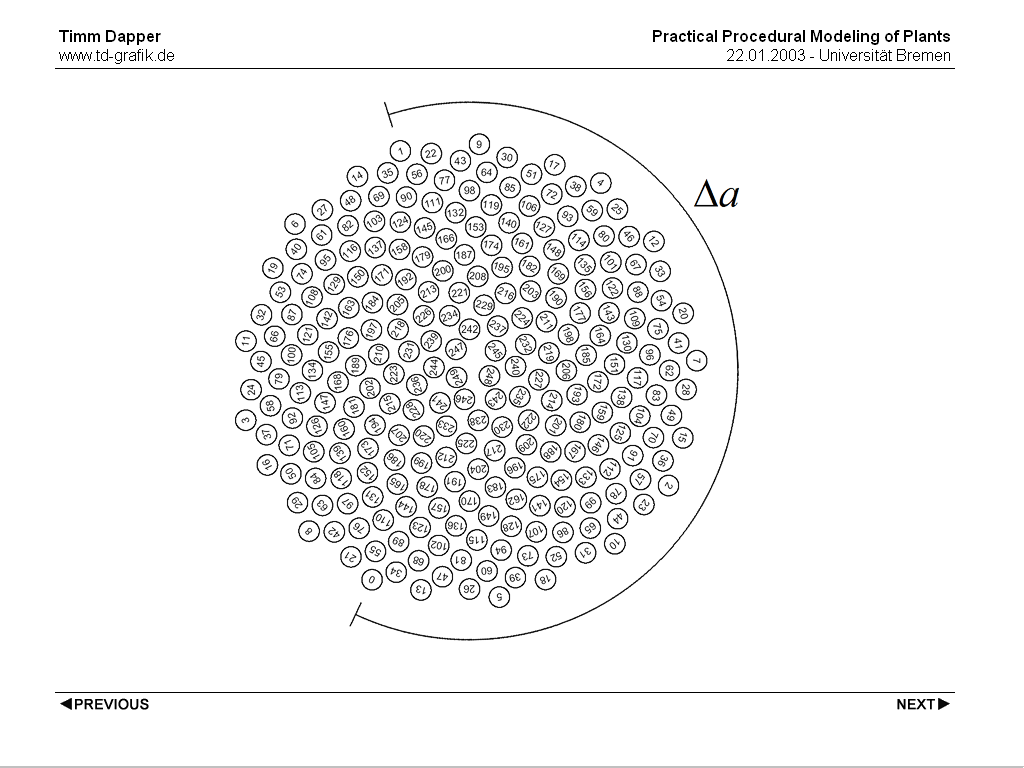
It consists of a simple rule for placement of organs on a disk. Each organ's rotation is the rotation of the former element with a fixed offset added. This offset angle is just presented there without giving any reason. It's said to be empirically based.
So where does this offest angle (phi) come from?
The angle is determined by the number phi, often also called the 'golden section' or 'golden mean'.
There are actually two numbers called phi, one with and one without a capital 'p'. Phi is just phi inverse (and interestingly Phi and phi have the same fractional part).
phi * 360 degrees yields 222.49�, sometimes (in simulation *and* in real plants) 360� - 222.49� is used instead. Plants seem to have a preference for one or the other value depending on which hemisphere they grow in. (Smith.edu)
The number phi appears to produce the best packing that can be produced by a constant offset. The constant offset is important for plants as once an organ grows at a certain place it cannot be rearranged easily. What nature seems to use is the same pattern to place seeds on a seedhead as it used to arrange petals around the edge of a flower *and* to place leaves round a stem. What is more, *all* of these maintain their efficiency as the plant continues to grow and that's a lot to ask of a single process!
The amazing thing is that a single fixed angle can produce the optimal design no matter how big the plant grows. So, once an angle is fixed for a leaf, say, that leaf will least obscure the leaves below and be least obscured by any future leaves above it. Similarly, once a seed is positioned on a seedhead, the seed continues out in a straight line pushed out by other new seeds, but retaining the original angle on the seedhead. No matter how large the seedhead, the seeds will always be packed uniformly on the seedhead.
And all this can be done with a single fixed angle of rotation between new cells? Yes! This was suspected by people as early as the last century. The principle that a single angle produces uniform packings no matter how much growth appears after it was only proved mathematically in 1993 by Douady and Couder, two french mathematicians.
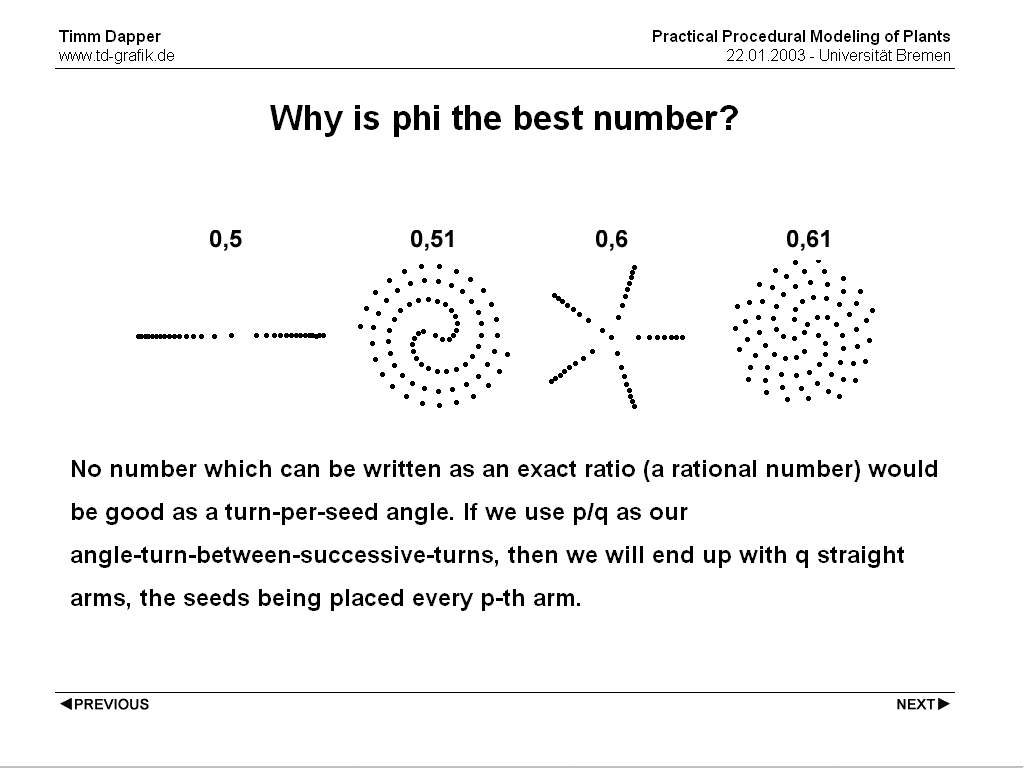
Trying other numbers tends to always converge to a pattern with a number of 'arms' going from the center outwards. Depending on the number the pattern may need longer to exhibit these arms, but all number will eventually end up with a fixed number of arms.
Actually it turns out that: "No number which can be written as an exact ratio (a rational number) would be good as a turn-per-seed angle. If we use p/q as our angle-turn-between-successive-turns, then we will end up with q straight arms, the seeds being placed every p-th arm."
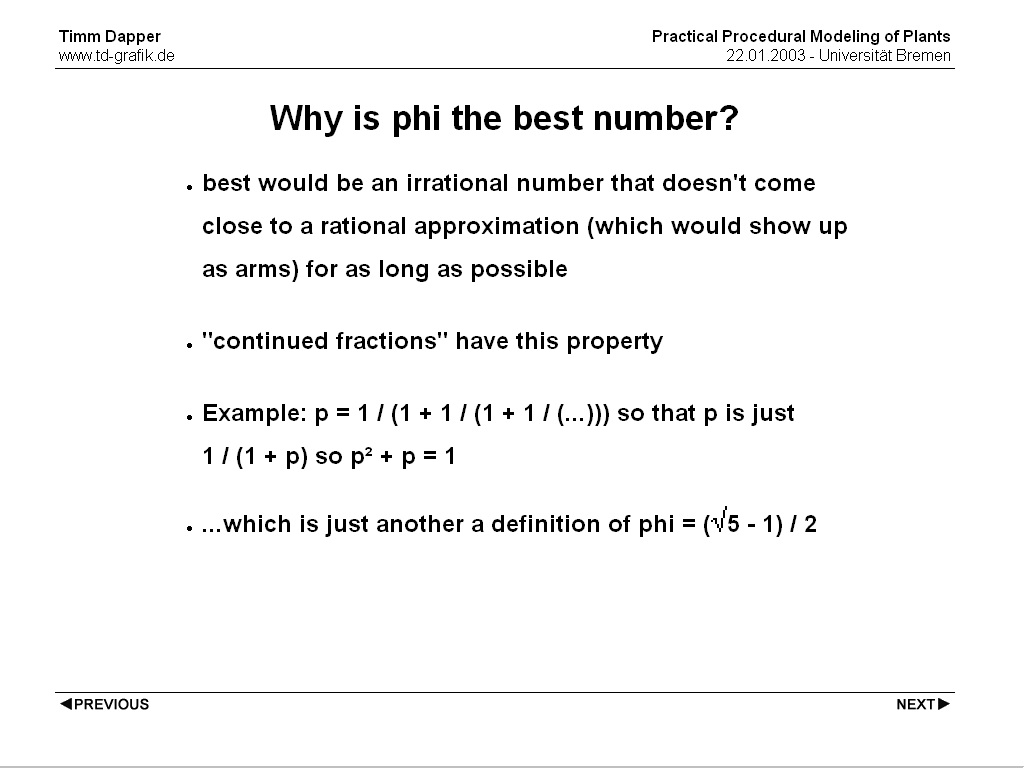
So what is a "good" value? One that is *not* an exact ratio - an irrational number such as sqrt2, Phi, phi, e, pi and any any multiple of them. Still not all of these values work very good.
While still being irrational some of these values can be approximated by rational fractions pretty good. 355/113 is already a very good approximation to pi, the error is only 0.000000266. The best approximation to sqrt(2) with a denominator less than 200 is 239/169 and has an error or 0.0000124. This is much less satisfactory.
Observations like these have led mathematicians to set up a hierarchy among irrational numbers, according to how difficult they are to approximate with rationals. It is in this sense that one irrational is more irrational than another.
What is "the best" irrational number? One that never settles down to a rational approximation for very long. Number having this property are called continued fractions. Phi is such a number.
For a nice coverage of why phi is the 'most irrational' number, see: www.ams.org/new-in-math/cover/irrational1.html
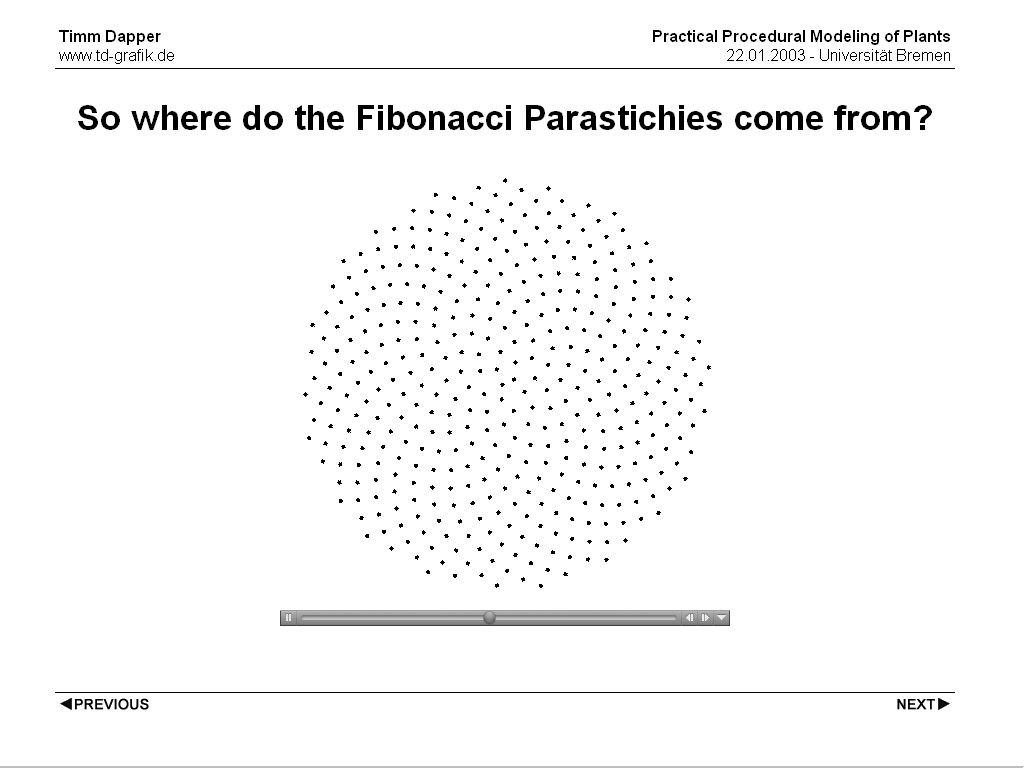
This still leaves the question unanswered where the Fibonacci Parastichies come from. First of all, these parastichies are in the first place just generated by the human perception. Actually there are lot's of parastichies contained in phyllotactic patterns, it's just that with a certain number of organs some parastichies get visually more important than others. [animation] When looking at the animation one can see that the parastichies that appear at the outer bound of the simulated flowerhead change over time.
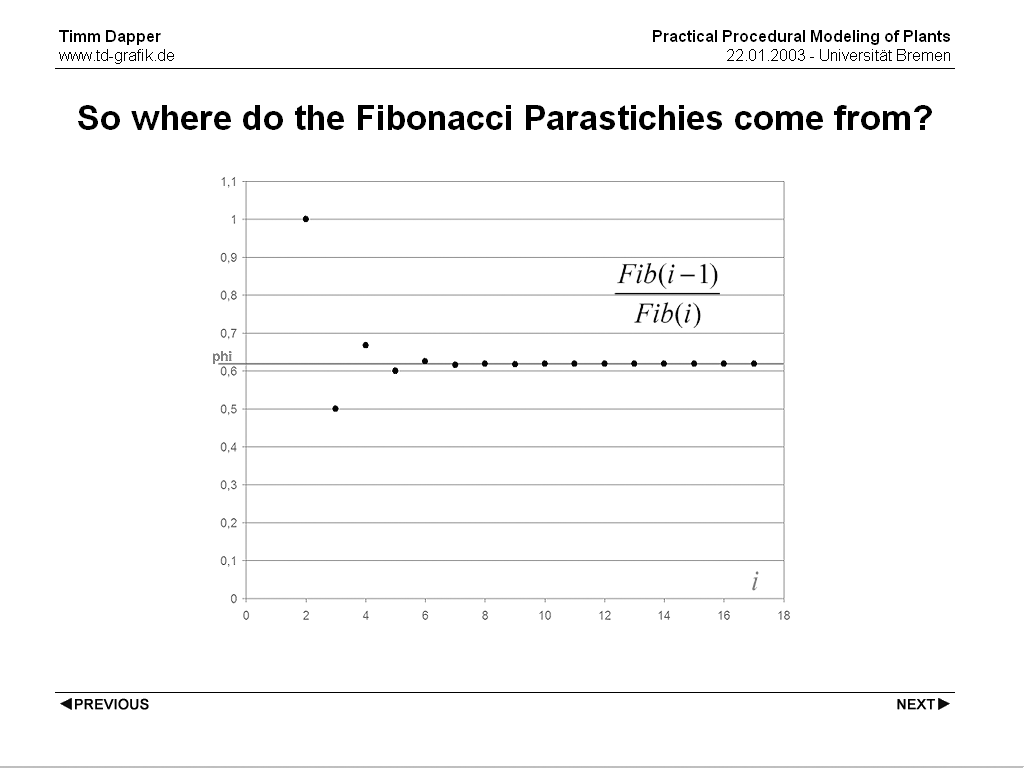
The reason why the eye is tricked into seeing parastichies that have the number of following Fibonacci Numbers is an interesting property of the fibonacci numbers. The quotient of any pair of consecutive Fibonacci numbers is an approximation of phi and with the Fibonacci Numbers used being abitrarily high, the approximation get's abitrarily close to the exact value of phi. So what the eye sees is just what the straigt 'arms' are for rational numbers, but since phi is irrational it never settles on a number of 'arms' but the visually most apparent spirals change while the number of plant organs changes (also in the inner part of plant organs often other spirals seem to be more dominant than in the outer part). The Fibonacci numbers only being an approximation is the reason why one see's spirals and not straight arms.
"An interesting fact is that, for ALL series that are formed from adding the latest two numbers to get the next, and, starting from ANY two values (bigger than zero), the ratio of successive terms will ALWAYS tend to Phi!" (definition of continued fractions?)
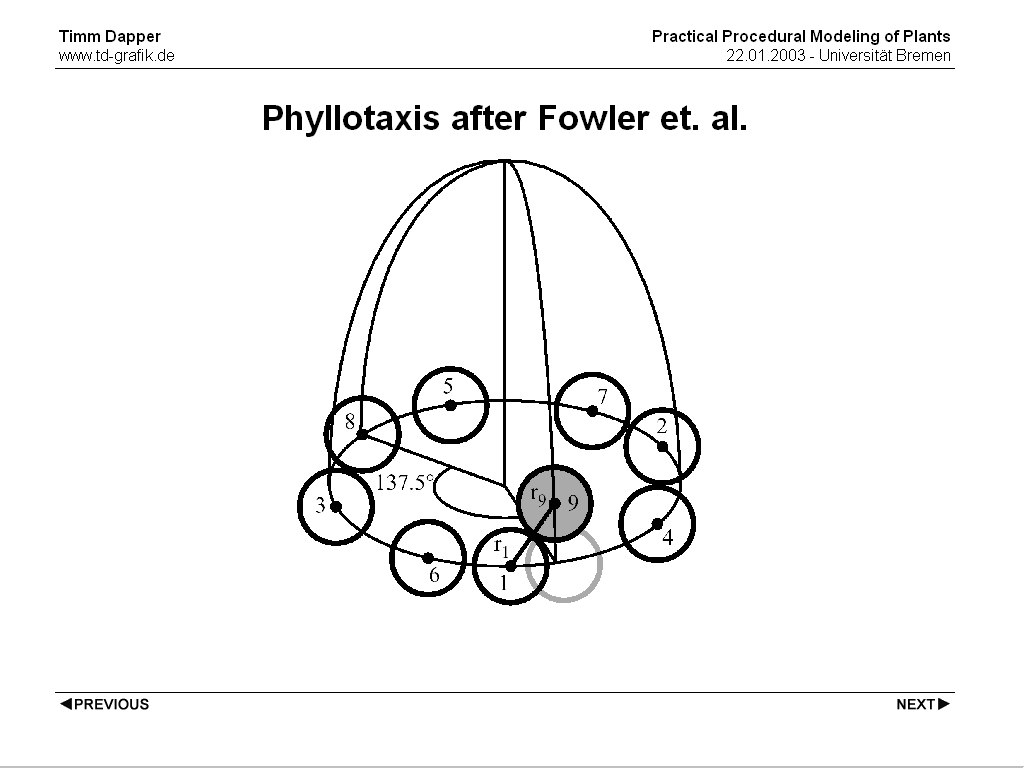
Another model which tries to be less descriptive and more explanatory has been introduced by Fowler in 1992. It works on abitrary surfaces of revolution. Basically the organs grow at the top of the 'meristem' and then fall down the outline curve until they collide with an existing organ. They are then placed tangential to the organ they hit. The line each organ falls down at is rotatet by phi.
This is a somewhat explanatory model as it actually considers the size of the organs and their interaction. Still the rotation of phi for each succeeding organ is not explained by the model and the pattern forming the plant is in reality determined when the early form of the plant organ (the primordium) is first created at the tip of the 'meristem'. Also this model has some practical modeling drawbacks. It is for example hard to estimate the actual number of plant organs on the receptacle one ends up with. If one wants to create a certain number of organs/visual appearance one has to change the parameters, run the simluation, change the parameters again and so on.
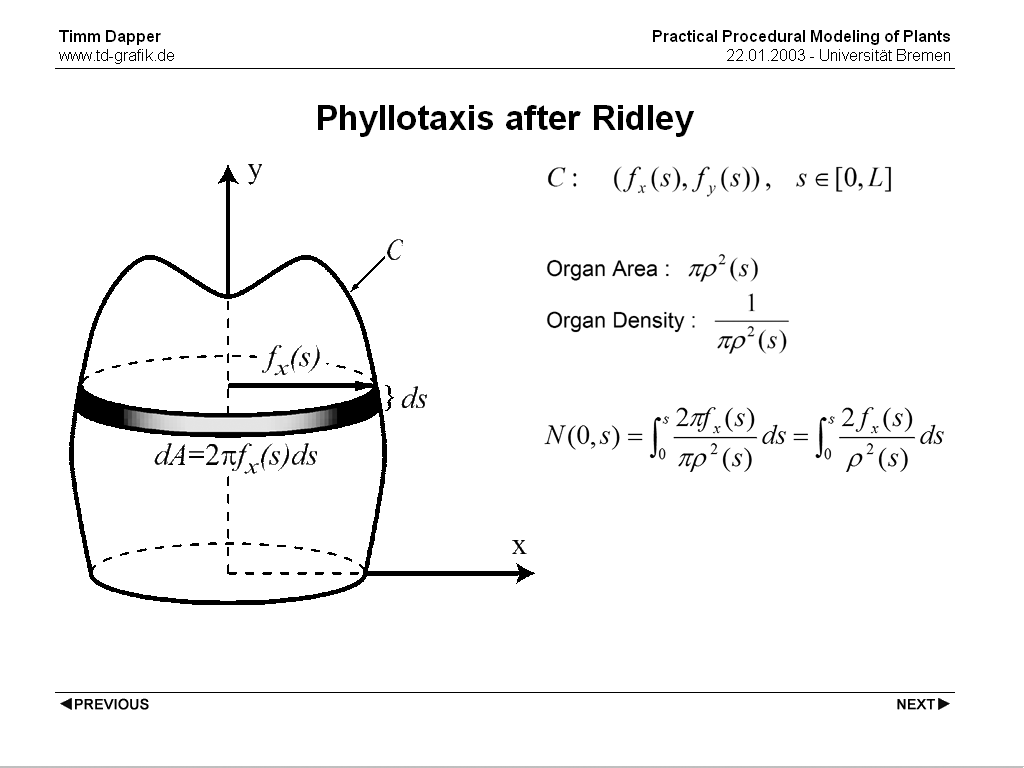
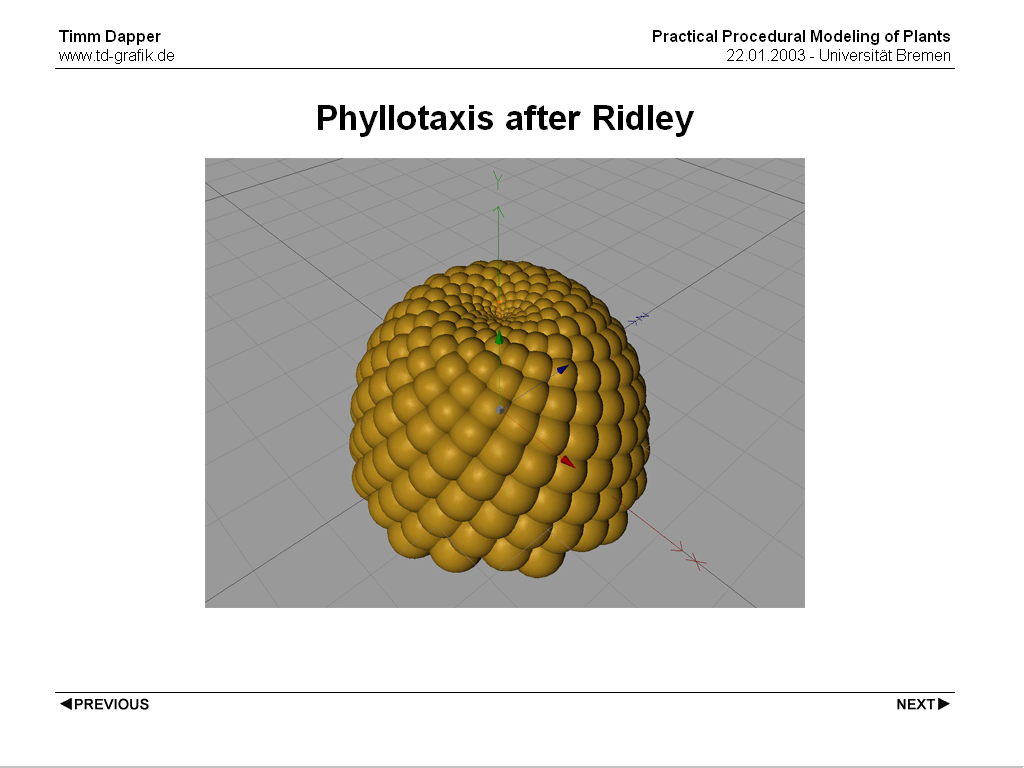
Ridley presented a model in 1986. It's similar to the former in that it also operates on abitrary surfaces of revolution, but it's completely descriptive again. Here each plant organ is rotated by phi against it's predecessor (around the axis of revolution of the underlying surface of revolution). The distance along the outline curve from the start to the position of each organ is brought into relation with the radius of the supporting surface as well as to the size of the organs. Both the Outline curve and the organ size can be defined as abitrary functions.
Let (fx(s), fy(s)), s e [0, L] be a parametric planar curve C that generates the receptacle (supporting surface) when rotated around the y axis of the coordinate system. We assume chord-length parametrization of the curve C, which means that parameter s is the arc-length distance of point (fx(s), fy(s)) from the origin of the curve. The area dA of the infinitesimal slice of the receptacle generated by the arc [s, s+ds] is then equal to 2*pi*fx(s)*ds. We denote by pi*ro^2(s) the area occupied by an organ placed on the receptacle at a distance of s from the origin of the generating curve C. => We can interpret 1/pi*ro^2(s) as the organ density at s. The integer part of the Integral
[INTEGRAL]
is then equal to the total number of organs placed in the portion [0, s] of the receptacle. Consecutive organs are placed at locations that increment N(0,s) by one.
So do plants know math?
It has been talked a lot about why these patterns turn out to be very good, but how do
these patterns actually develop? This is going to be a short paragraph because there's
no definite answer to that, yet.
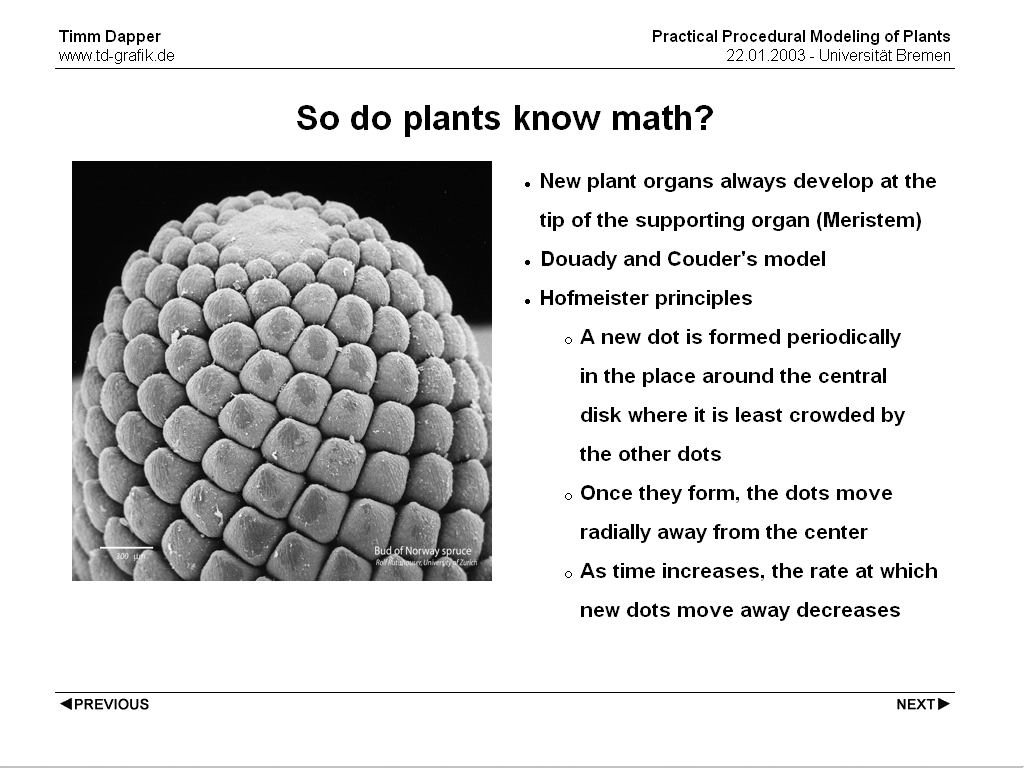
Botanists have shown that plants grow from a single tiny group of cells right at the tip of any growing plant, called the meristem. There is a separate meristem at the end of each branch or twig where new cells are formed. Once formed, they grow in size, but new cells are only formed at such growing points. Cells earlier down the stem expand and so the growing point rises.
Even though the phenomenon of phyllotaxis has been observed for hundreds of years and studied by many botanists and mathematicians, only recently has there been a begining of an answer. There is a model by the french physicists Stephane Douady and Yves Couder, who came up with a simple model for the formation of these spiral patterns, which they implemented both physically and on the computer. This model, based on assumptions made by the botanist Hofmeister, spontaneously generates the Fibonacci spiral patterns. The three basic principles of Hofmeister on which this model is based are the following:
Very common is the use of a pieline system to create ecosystems, consiststing of a number of succeeding steps such as: Terrain Specification -> Distribution Specification/Simulation -> Plant Specification while this works well for most cases and is relatively inexpensive in terms of memory use and computational overhead, it has some limitations. More realistic would be the use of a cyclic model. A cyclic model could for example incorporate the geomtry of a plant to detect how much shadow it casts on other plants and use that in a simulation step.
Depending on what you want to use the Ecosystem for there are basically two steps in generating a virtual ecosystem which can be used alone or in conjunction.
Direct specification of distributions is also referred to as global-to-local because a global specification of the structure of an ecosystem is used to determine local plant positions.
There are a number of techniques in explicitly specifying a plant distribution, they can roughly de devided in two categories - individuum-based and density-based. The former operates with actual plant positions usually created with something like the spray function of your average drawing application. Processing steps can also be point distance relaxation, thinning, smearing, etc. The other represents plant distributions not as a number of discrete plants but as a set of plant densitiy maps, which are later converted to the actual positions. These two could also be used in conjunction (individuum-based as postprocessing step to density-based).
These distributions can be created by hand in an interactive program of imported from for example sattelite imagery. Different plant species tend to have characteristic reflection properties that can be recorded by a sattelite and used to extract density maps.
Simulation of Plant distributions is also referred to as local-to-global, because local interactions on the level of individual plants lead to the global appearance of the simulated environment.
Things to take care of in these cases are environmental factors such as temperature variations (on a very large scale), humidity, groundwater level, air pressure (some plants don't grow very high/low), soil, etc. as well as interactions between plants.
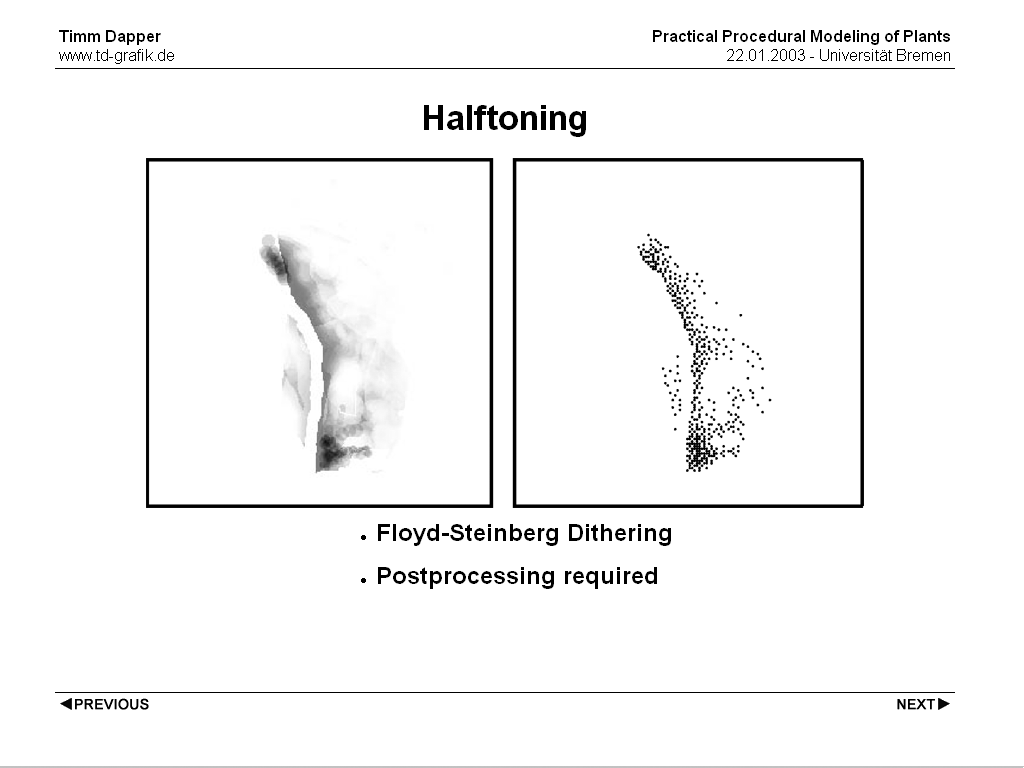
One way to create plant positions from density maps is using halftoning techniques, well known from desktop publishing and printing. Suitable are all algorithms that produce points of uniform size varied in distribution density to represent the grayscales. One algorithm that produces very good results for plant distributions is the Floyd-Steinberg Algorithm. Some postprocessing is required to the points, as halftoning algorithms usually operate on a regular grid which could produce ugly patterns in the plant positions.
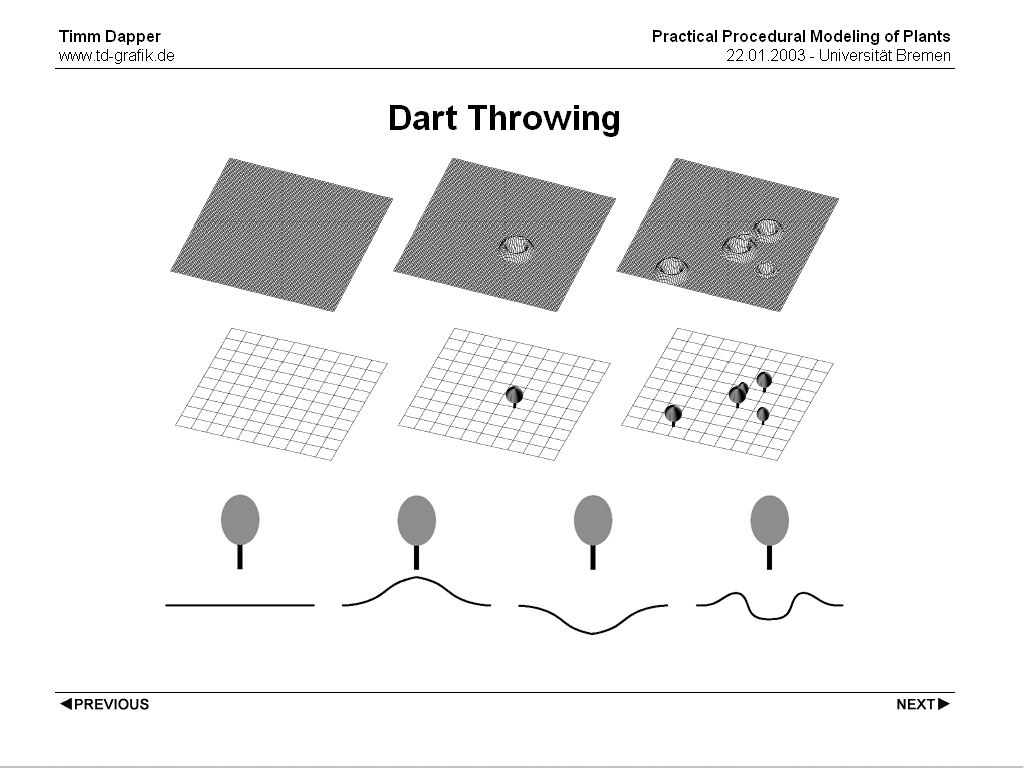
Another technique commonly used is Dart Throwing. It randomly places points in the target area and these points can be accepted or rejected according to come criteria. Criteria could be the grayscale value of the density map (used as a probability) and/or the distance to existing positions. This algorithm also makes it easy to incorporate another phenomenon that can be commonly seen in plant populations. Often plants influence the probability of other plants growing nearby them in a positive or negative way. This probability of other plants growing nearby can be easily integrated by incorporating a function based on the distance between an existing and the new plant position into the rejection criterion.
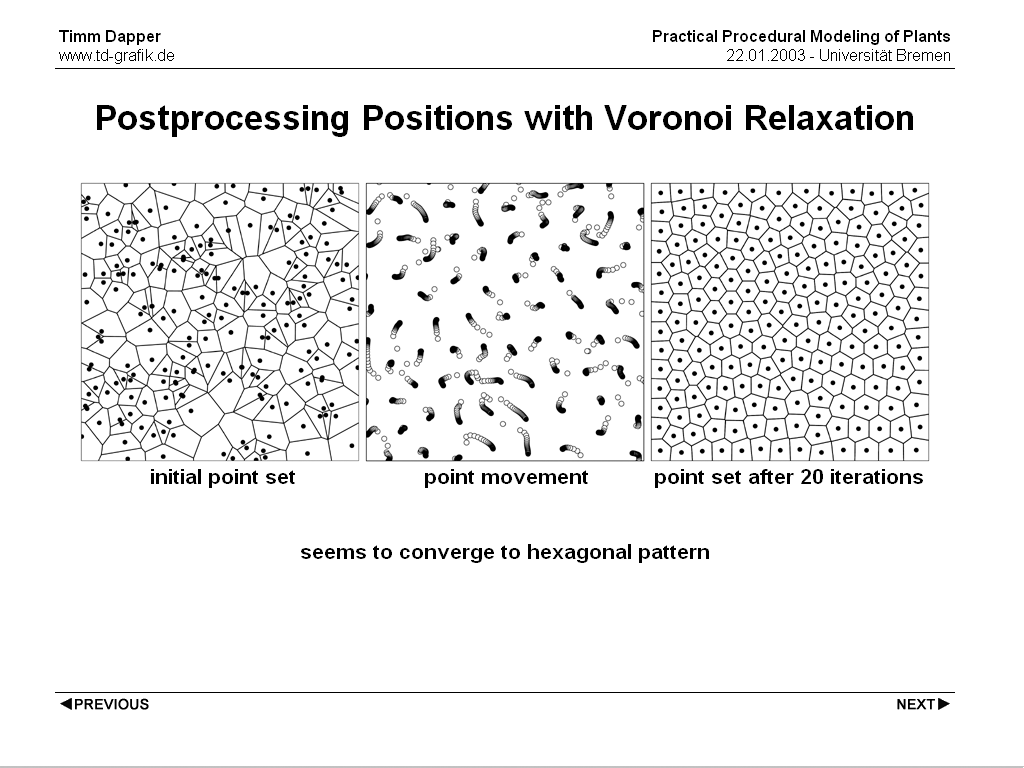
When a randomly created set of points is given it may be desireable to smooth it out for example to ensure some minumum distance between plant positions to prevent intersections. A good algorithm to archive this is Lloyd's Method. In that method each point is moved to the centre of gravity of it's Voronoi Polygon. If this is repeated a number of times distances between the points smooth out. Actually in practical tests the voronoi polygons tend to form hexagonal patterns with increasing number of iterations. This always seems to be the case, but still there has not been a proof that this is correct for the general case.
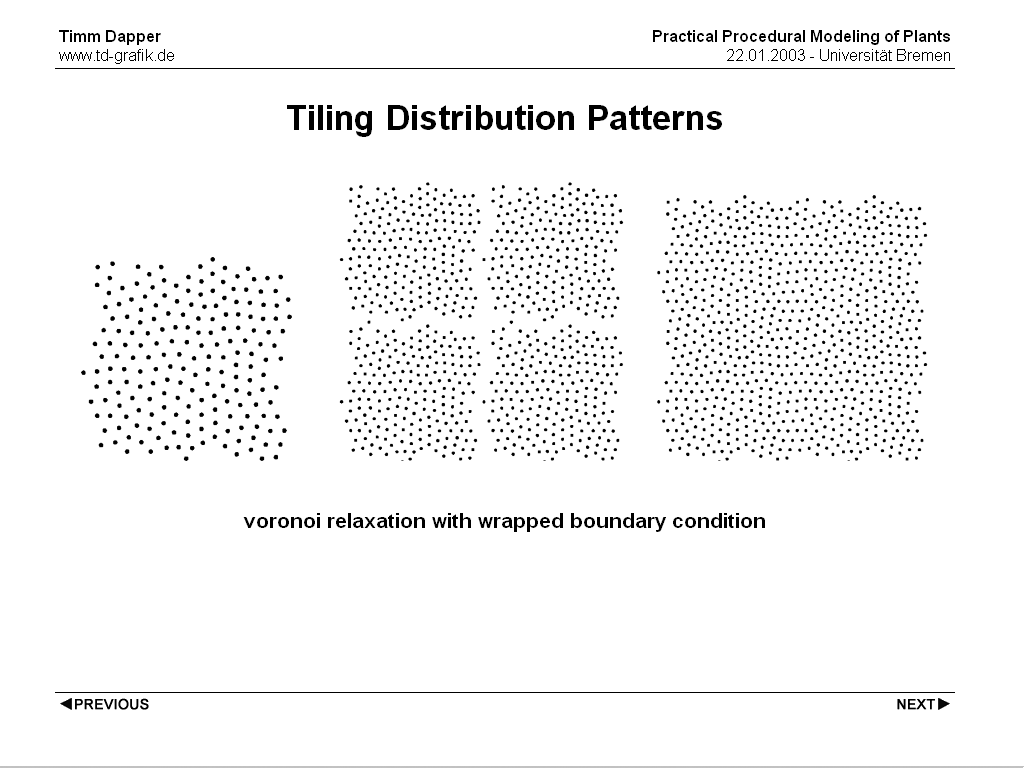
Another way is to precompute tiles with plant positions and tiling them. Generally this will lead to visible borders between the tiles, but if the boundary condition for the Voronoi Relaxation is adjusted tiles that maintain their distribution pattern over the boundary can be created.
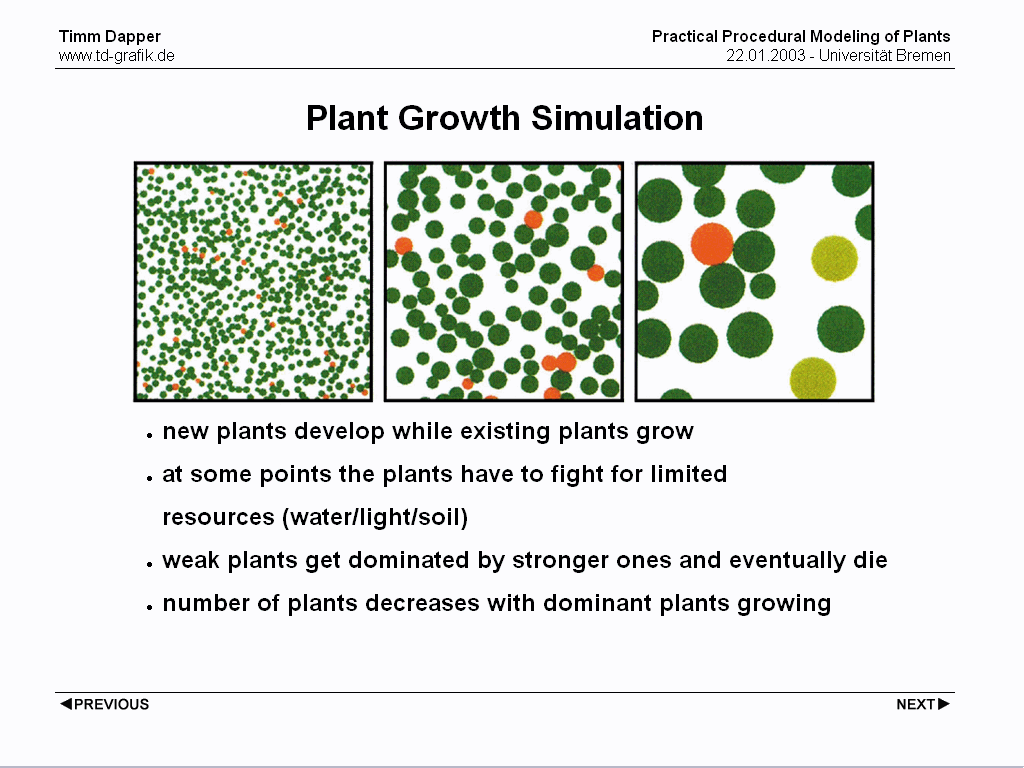
A very important aspect in plant populations is the fight for resources, such as light. This leads to typical changes over time in the population, which shall be simulated here. Usually the number of plants in a population of growing plants does not increase any more at some point - the population reached a certain maximum density. This density changes over time as the plants continue to grow. The bigger each individual plant get's the fewer can survive with the given amount of resources.
In this simple simulation plants shown as small circles with slighly varying radius were distributed on a plane. Growth means increase in diameter. When two circles collide, the smaller one dies due to domination by the bigger one. Once plants have reached a certain maximum size don't grow any bigger and eventually die.
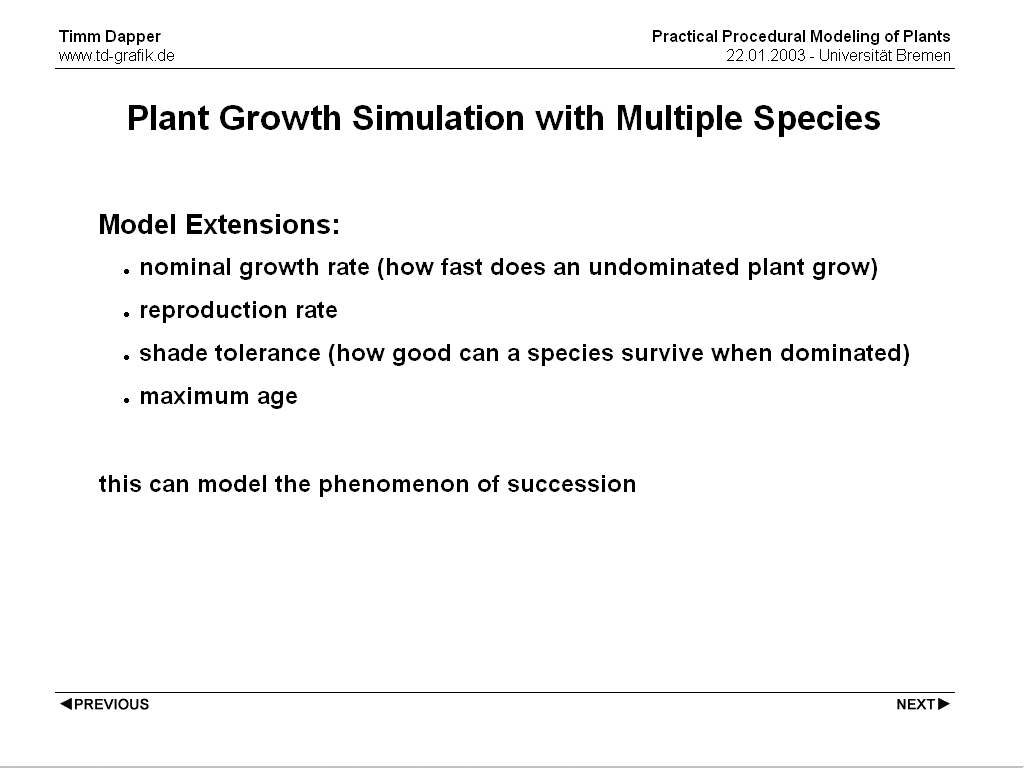
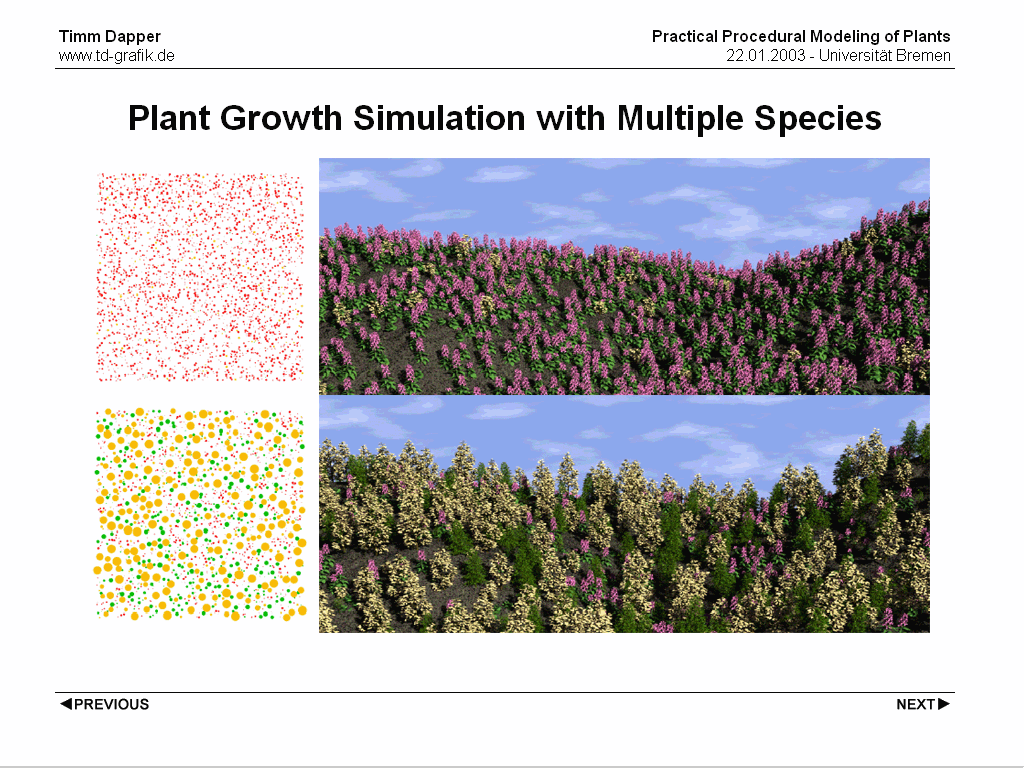
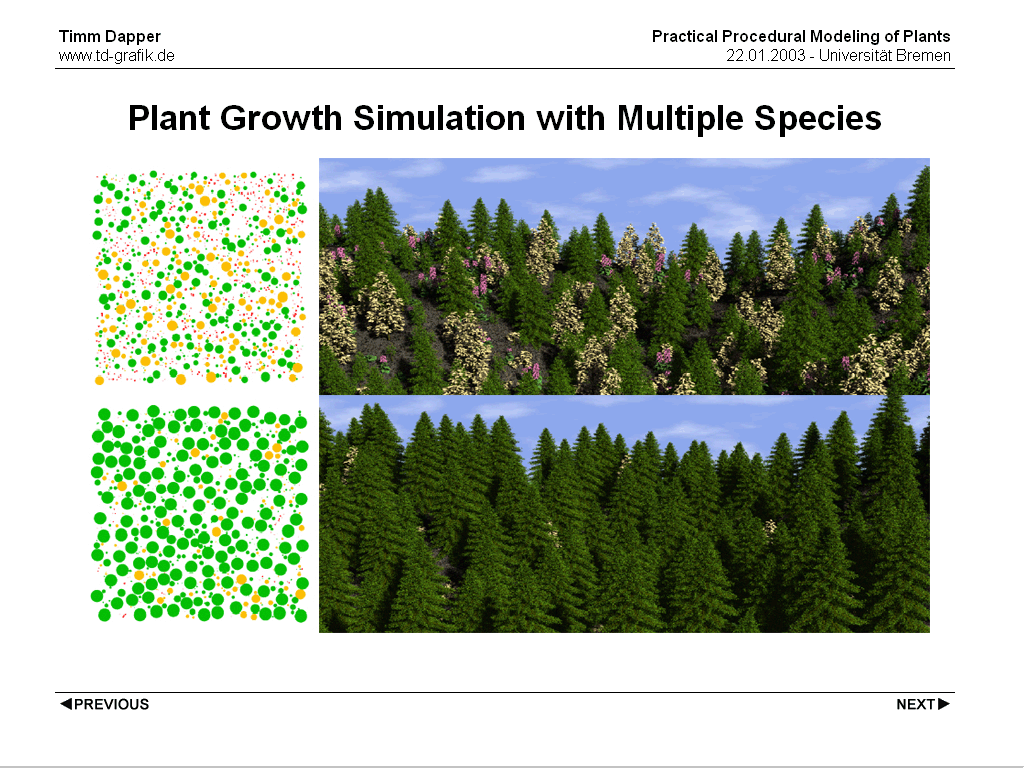
A more sophisticated model extends these mechanisms to the interaction between plants of different species. Each plants has an extended set of parameters (see slide). The simulation runs like in the former model, but once two plants collide, the smaller one only get's removed with the probability indicated by shade tolerance. Th�s pays attention to the fact that certain species can pretty well survive whith other plants nearby get most of the resources, while other species don't. This model captures a phenomenon known as succession. The following images illustrate this effect. If species 1 has a higher growth rate but lower shade tolerance and maximum age than species 2, then an initially empty field will be populated in stages. As the largest members of species 1 die, smaller members of species 2, which have survived due to their greater shade tolerance and now have a size advantage over the new seedlings of species 1, will fill in the gaps. Eventually the field will be dominated by members of species 2. The images show this same model extended to three species.
Huge scenes with thousands of plants present a set of problems that is being adressed here.
After running a simluation there are usually a huge number of plants of the same species representing a huge amount of data and is in most cases not apparent. Usually it's sufficient to pick a small number of representatives of a certain species (1-4), variation of size and rotation will in most cases hide the fact that only very few individual plant models exist.
Detailed plant models tend to consist of hundrets of thousounds of polygons or even more. This is fine for closeups, but at a different scale there polygons get smaller than a single pixel which is unnecessary and may make them an aliasing problem. This problem is especially apparent in big camera moves (like a camera moving into our out of a landscape). Changing the representation to types that are cheaper (lines, points or billboards) can solve that problem. Another way is to try to use culling schemes to detect plants or parts of plants that are occluded anyway and not generate/load them.
Plant models that are just too complex for a scene can be simplified based on the view of the virtual camera...
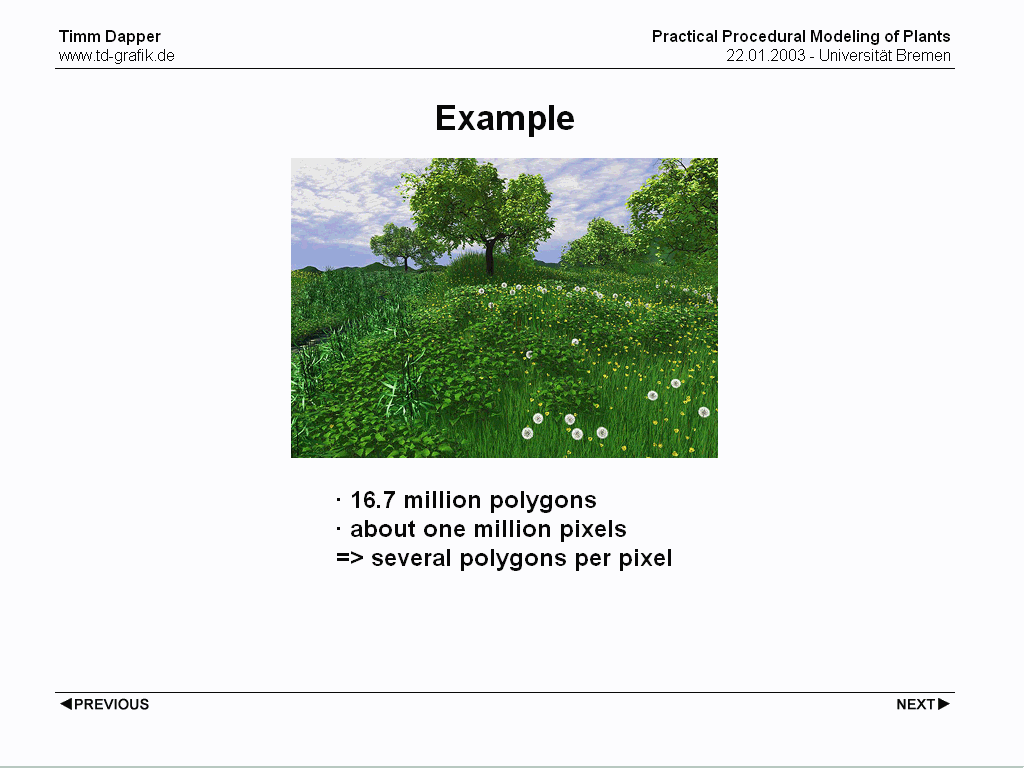
The example shows the problem of over-specification, mainly produced by too complex models.
Static Level Of Detail approaches usually work with a fixed set of Models at a certain Level Of Detail. The representation is switched between two representation when the model get's smaller/bigger in screen space and crosses a certain threshold. This can lead to visible popping artifacts. These artifacts can be hidden by smoothly blending between two representations, but the blending should be kept short because when a model is blended between two representations both representations have to be held in memory. All representations have to be stored, either in memory or on disk, which leads to increased storage requirements.
In Dynamic Level Of Detail schemes the representation of the model is computed on the fly based on screen space size of the object. Given that appropriate algorithms are used this leads to less popping artifacts and there's no memory overhead. There *is* a computational overhead because representations have to be recomputed for each image. Also these method's don't mix very good with instancing.
The combination of both is possible, for example one could dynamically determine a number of representations that are created on the fly and used for instancing.
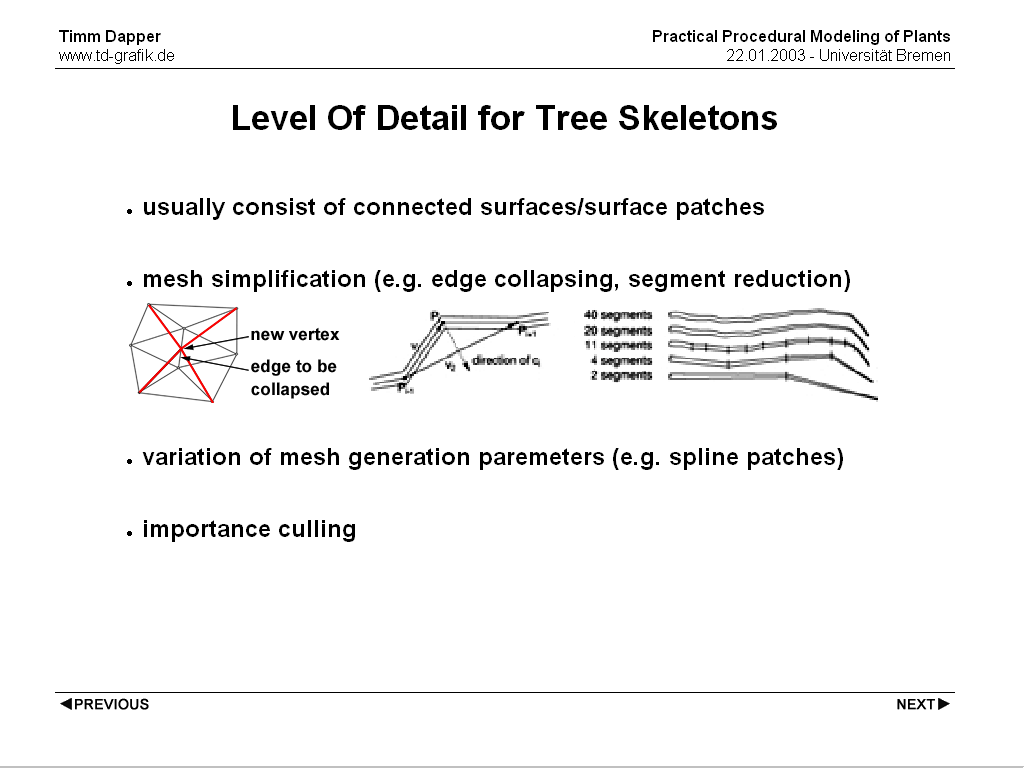
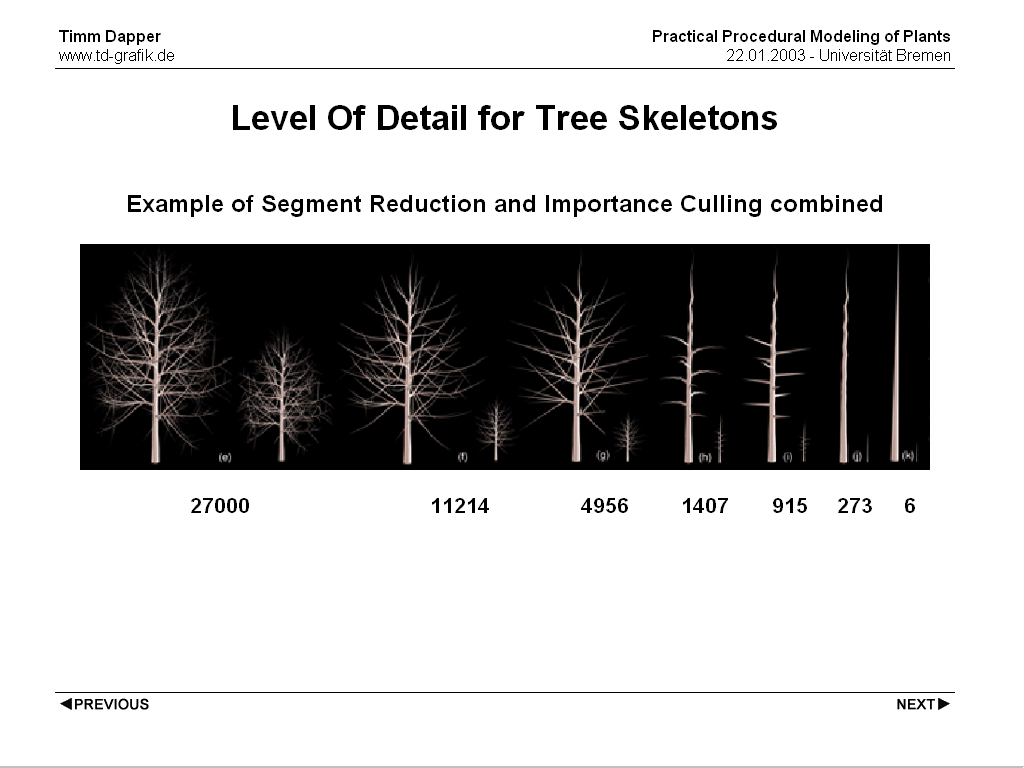
Most approaches that are specific to plants make use of the fact that the branches and the foliage have very different properties when it comes to complexity handling. The handling of the tree skeleton can be approached like the handling of any mesh because they are usually a rather simple closed surface. A lot of research is available here. One possible approache is mesh simplification by edge collapsing or the removal of length segments according to some error metric. Another one is the use of different dicing rates if the tree skeleton is created using spline patches. Additionally whole Branches that can be considered less important can be culled completely because their contibution to the final image is negleglible.
Foliage is very different and should be approached differently. The approaches taken for the Skeleton do usually not apply to the leaves because they tend to consist of a large number of isolated surfaces. What helps us here is the observation that leaves are usually not perceived as a countable collection of indiviual objects (starting at a certain distance), but as a pattern with a certain light distribution and coverage of the background. As long as the tree is obvserved from a distance where the leaves are not clearly recognizable as single objects, the number of leaves is less important than the reflection properties and the coverage. In those cases foliage can be represented by fewer leaves as long as those properties stay the same without degrading image quality too much.
This is similar to methods often used when rendering hairs or fur. The number of hairs is reduced while their thickness is increased (Final Fantasy).
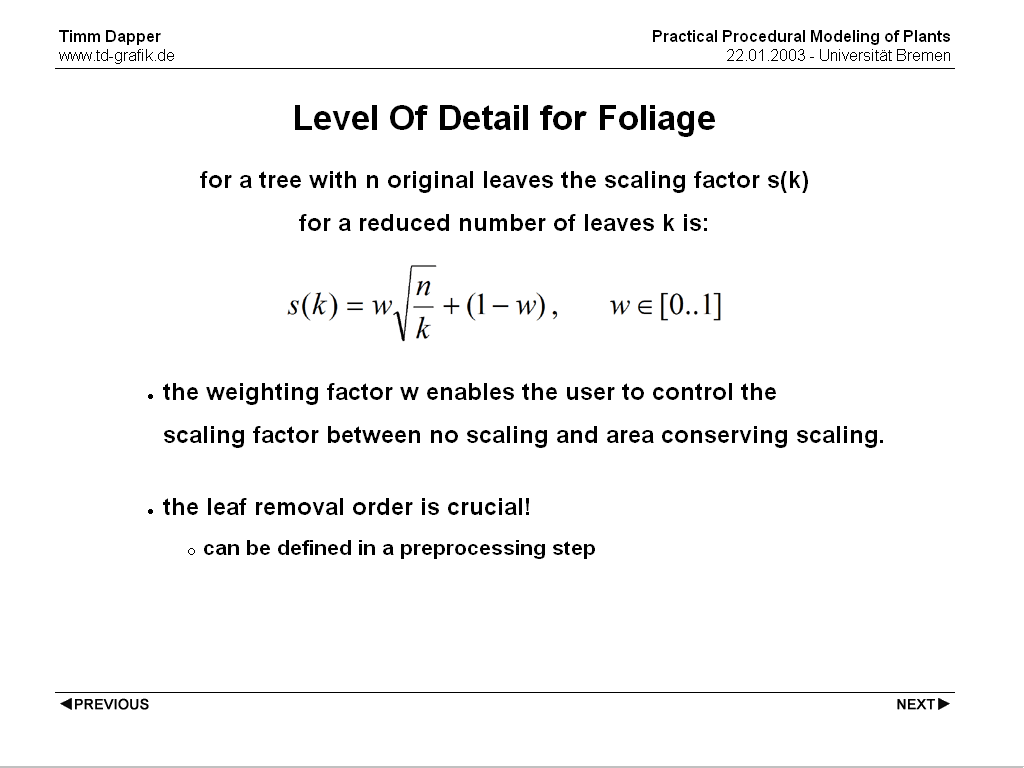
Tests have shown that the area conserving scaling often yields too sparse foliage. Also the order in which leaves are removed is very important, as leaves need to be removed. The leaves should be removed from all regions of the foliage with equal probability, there should be no visible periodicity and if a leaf is removed, the successing removals should not be in the same area.
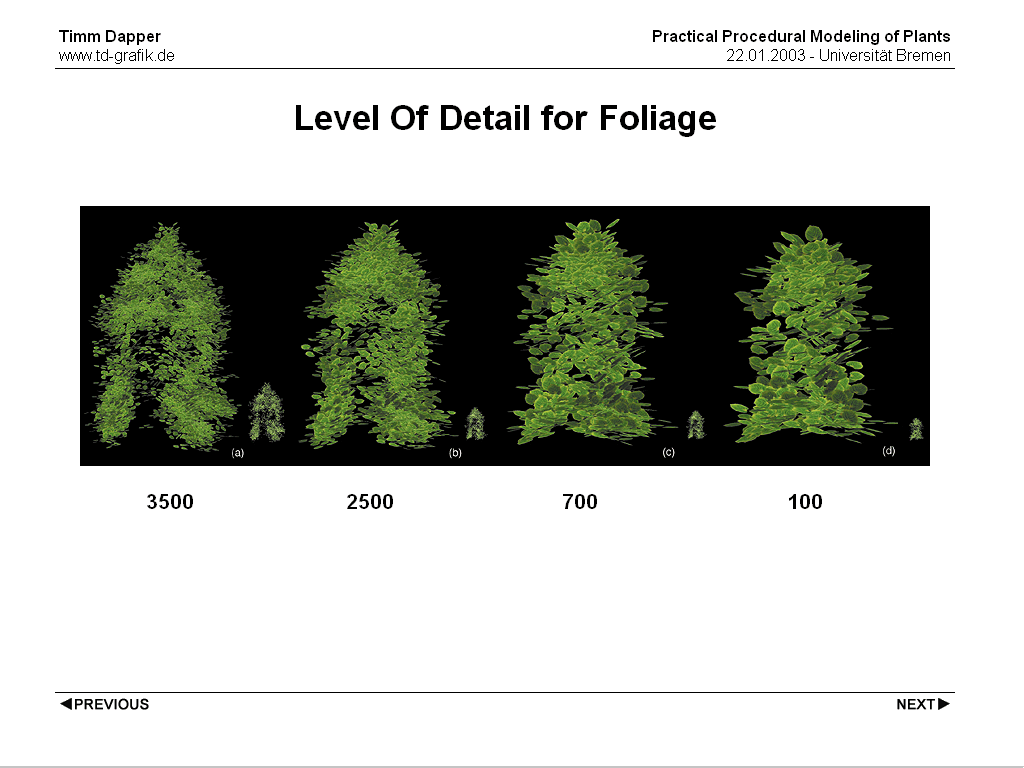
In this example the number of leaves is reduced while the remaining leaves are scaled to maintain the coverage.
Point/Line based approach - In a preprocessing step a point/line representation is created and a per part importance is specified - polygons that get smaller than a certain limit get replaced by their respective points/line segments - point order (linear reduction) points have fixed size